South of Fifth Recently Sold & Values, Miami Beach
69 homes sold in South of Fifth, Miami Beach in the six months to November 7, 2026, at a median $1,025,000 ($1,044 per square foot) and 94.5% of the asking price, after an average 87 days on the market; 170 are for sale now.
Recent South of Fifth sales show what buyers paid. A strategy review shows what they mean for your home.
Every home, condo and townhome that closed in South of Fifth, Miami Beach, Florida in the last six months, newest first, with the sale price and days on market straight from BeachesMLS.
Homes that closed in South of Fifth, Miami Beach in the last six months, newest first, with the sale price, price per square foot and days on market for each. South Pointe Park, Government Cut and full-service towers. These closings are what a South of Fifth valuation is built on.
Own a Home in South of Fifth? These Sales Set Its Value
A broker compares your home with the closings below and the buyers already working with BreakThru Realty, and calls you with a written value range and your selling options. No fee, nothing listed until you decide.
Find Out If Your Buyer Is Already Looking · Get My Miami Beach Home Value
South of Fifth Market at a Glance
Updated November 7, 2026 from BeachesMLS: homes and condos in South of Fifth, Miami Beach.
| Active listings | 170 |
|---|---|
| Median list price | $1,337,500 |
| Median list price per sq ft | $1,242/sq ft |
| Average days on market | 129 days |
| Sold in the last 180 days | 69 |
| Median sold price (180 days) | $1,025,000 |
| Median sold price per sq ft | $1,044/sq ft |
| Average days to sell | 87 days |
| Sale price as % of list price | 94.5% |
| Months of inventory | 14.8 months |
| Median sold price vs. a year ago | -21.2% |
Source: BeachesMLS, listings whose subdivision or remarks name South of Fifth. Sold figures cover closings in the last 180 days, compared with the same 180 days one year earlier. Not an appraisal.
The 48 newest sales are below; see every match with map and filters.
The 48 sales on this page run from $370,000 to $14,500,000, with a median of $1,075,000, about $1,054 per square foot, and they sold in a median of 56 days.
The communities with the most sales here are Portofino Tower (4), Yacht Club at Portofino C (4), Continuum on South Beach (3), Five Park (3) and South Pointe Towers (3), 17 of the 48; the others are spread across 24 more communities. By type: 47 condos and 1 townhome or villa. Bedrooms run from studios to 4, a median of 2; they were built between 1967 and 2025, a median of 2003, and 8 in the last ten years. 5 of the 48 had a pool, and 30 were on the water. They sit in 2 ZIP codes: 33139 and 33141.
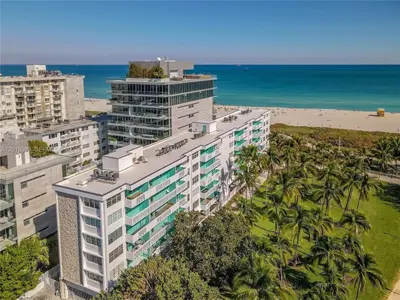 Sold $680,000
Closed Nov 5, 2026 · 301 Ocean Drive 306, Miami Beach FL 33139
1 bd · 1 ba · 640 sq ft · $1,063/sq ft · 152 days on market · 97.8% of list price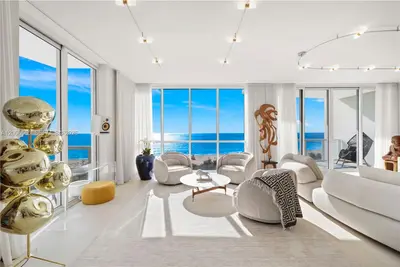 Sold $14,500,000
Closed Nov 4, 2026 · 50 S Pointe Drive 1201/08, Miami Beach FL 33139
3 bd · 3.5 ba · 3,497 sq ft · $4,146/sq ft · 159 days on market · 85.8% of list price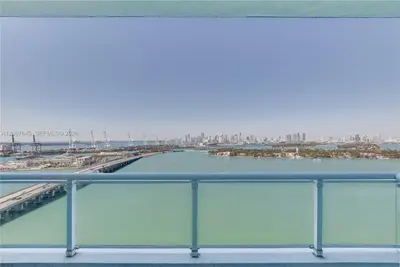 Sold $800,000
Closed Nov 3, 2026 · 540 West Avenue 2112, Miami Beach FL 33139
1 bd · 1 ba · 779 sq ft · $1,027/sq ft · 135 days on market · 94.1% of list priceSold $1,500,000
Closed Oct 30, 2026 · 400 Alton Road 2309, Miami Beach FL 33139
2 bd · 2 ba · 1,437 sq ft · $1,044/sq ft · 283 days on market · 95.3% of list price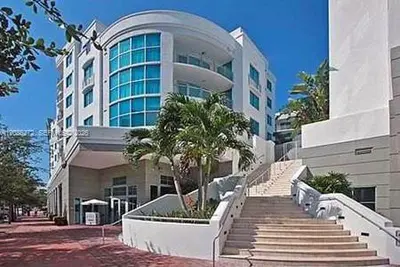 Sold $660,000
Closed Oct 30, 2026 · 110 Washington Avenue 1802, Miami Beach FL 33139
1 bd · 1.5 ba · 826 sq ft · $799/sq ft · 21 days on market · 94.4% of list priceSold $1,650,000
Closed Oct 28, 2026 · 245 Michigan Avenue LG-5, Miami Beach FL 33139
3 bd · 3 ba · 1,798 sq ft · $918/sq ft · 49 days on market · 94.3% of list price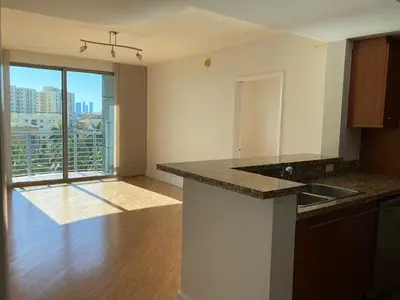 Sold $840,000
Closed Oct 23, 2026 · 110 Washington Avenue 1717, Miami Beach FL 33139
2 bd · 2 ba · 1,010 sq ft · $832/sq ft · 192 days on market · 93.4% of list priceSold $470,000
Closed Oct 23, 2026 · 345 Ocean Drive 924, Miami Beach FL 33139
1 bd · 1 ba · 654 sq ft · $719/sq ft · 95 days on market · 88.8% of list priceSold $1,600,000
Closed Oct 22, 2026 · 90 Alton Road 1102, Miami Beach FL 33139
2 bd · 2 ba · 1,130 sq ft · $1,416/sq ft · 45 days on market · 95.8% of list price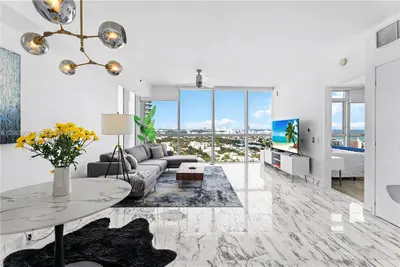 Sold $950,000
Closed Oct 22, 2026 · 450 Alton Road 3008, Miami Beach FL 33139
1 bd · 1.5 ba · 851 sq ft · $1,116/sq ft · 6 days on market · 95.5% of list priceSold $1,060,000
Closed Oct 9, 2026 · 245 Michigan Avenue LP-4, Miami Beach FL 33139
2 bd · 2 ba · 1,488 sq ft · $712/sq ft · 183 days on market · 92.6% of list price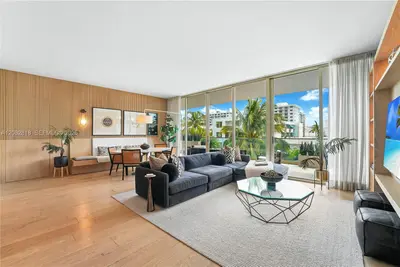 Sold $2,700,000
Closed Oct 6, 2026 · 300 Collins Avenue 3A, Miami Beach FL 33139
2 bd · 2.5 ba · 1,504 sq ft · $1,795/sq ft · 3 days on market · 94.7% of list price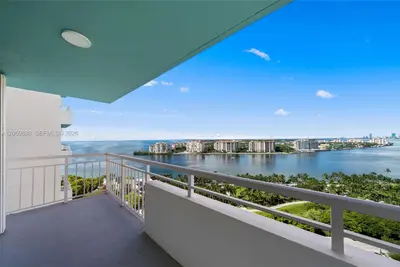 Sold $1,135,000
Closed Sep 30, 2026 · 400 S Pointe Drive 1905, Miami Beach FL 33139
2 bd · 2 ba · 1,042 sq ft · $1,089/sq ft · 2 days on market · 90.8% of list priceSold $2,280,000
Closed Sep 29, 2026 · 500 Alton Road 2207, Miami Beach FL 33139
2 bd · 2.5 ba · 1,451 sq ft · $1,571/sq ft · 220 days on market · 98.1% of list price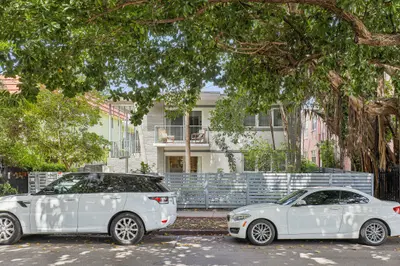 Sold $370,000
Closed Sep 18, 2026 · 740 Meridian Avenue 11, Miami Beach FL 33139
2 bd · 2 ba · 671 sq ft · $551/sq ft · 26 days on market · 92.7% of list priceSold $950,000
Closed Sep 17, 2026 · 650 West Avenue 1208, Miami Beach FL 33139
3 bd · 2 ba · 1,191 sq ft · $798/sq ft · 21 days on market · 95.1% of list price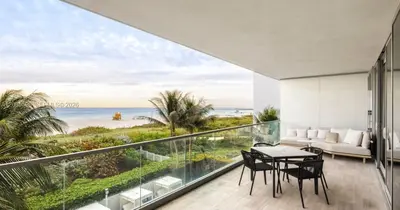 Sold $8,700,000
Closed Sep 17, 2026 · 321 Ocean Drive 301, Miami Beach FL 33139
3 bd · 3.5 ba · 2,530 sq ft · $3,439/sq ft · 1 days on market · 100% of list priceSold $9,900,000
Closed Sep 16, 2026 · 321 Ocean Drive 200, Miami Beach FL 33139
4 bd · 4.5 ba · 3,745 sq ft · $2,644/sq ft · 176 days on market · 95.7% of list priceSold $3,900,000
Closed Sep 8, 2026 · 400 S Pointe Drive 1503/04, Miami Beach FL 33139
3 bd · 2 ba · 3,073 sq ft · $1,269/sq ft · 8 days on market · 97.5% of list priceSold $7,300,000
Closed Sep 8, 2026 · 100 S Pointe Drive 3906, Miami Beach FL 33139
2 bd · 2.5 ba · 2,048 sq ft · $3,564/sq ft · 22 days on market · 91.3% of list priceSold $685,000
Closed Sep 3, 2026 · 225 Collins Avenue 5J, Miami Beach FL 33139
1 bd · 1 ba · 723 sq ft · $947/sq ft · 129 days on market · 91.4% of list priceSold $1,360,000
Closed Sep 1, 2026 · 500 Alton Road 1906, Miami Beach FL 33139
1 bd · 1.5 ba · 1,010 sq ft · $1,347/sq ft · 51 days on market · 91.3% of list priceSold $719,000
Closed Aug 31, 2026 · 140 Jefferson Avenue 14005, Miami Beach FL 33139
1 bd · 2.5 ba · 960 sq ft · $749/sq ft · 4 days on market · 100% of list priceSold $2,150,000
Closed Aug 26, 2026 · 300 S Pointe Drive 605, Miami Beach FL 33139
3 bd · 2.5 ba · 2,340 sq ft · $919/sq ft · 121 days on market · 93.7% of list price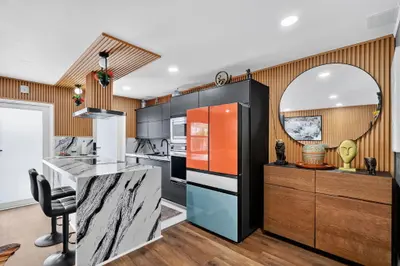 Sold $385,000
Closed Aug 26, 2026 · 363 Washington Avenue 32, Miami Beach FL 33139
1 bd · 1 ba · 590 sq ft · $653/sq ft · 138 days on market · 96.3% of list priceSold $500,000
Closed Aug 24, 2026 · 100 Jefferson Avenue 10004, Miami Beach FL 33139
1 bd · 1.5 ba · 960 sq ft · $521/sq ft · 7 days on market · 91.1% of list priceSold $8,450,000
Closed Aug 24, 2026 · 501 West Avenue 4303, Miami Beach FL 33139
3 bd · 4.5 ba · 2,451 sq ft · $3,448/sq ft · 3 days on market · 100% of list priceSold $4,200,000
Closed Aug 21, 2026 · 300 S Pointe Drive 1501, Miami Beach FL 33139
3 bd · 2.5 ba · 2,340 sq ft · $1,795/sq ft · 57 days on market · 84% of list priceSold $3,800,000
Closed Aug 19, 2026 · 50 S Pointe Drive 1005, Miami Beach FL 33139
2 bd · 2.5 ba · 1,698 sq ft · $2,238/sq ft · 304 days on market · 98.7% of list priceSold $1,090,000
Closed Aug 19, 2026 · 421 Meridian Avenue 15, Miami Beach FL 33139
2 bd · 2 ba · 1,013 sq ft · $1,076/sq ft · 20 days on market · 84.5% of list priceSold $650,000
Closed Aug 18, 2026 · 650 West Avenue 704, Miami Beach FL 33139
2 bd · 2 ba · 1,078 sq ft · $603/sq ft · 33 days on market · 91.5% of list priceSold $985,000
Closed Aug 17, 2026 · 650 West Avenue 2109, Miami Beach FL 33139
2 bd · 2 ba · 1,078 sq ft · $914/sq ft · 31 days on market · 99% of list priceSold $600,000
Closed Aug 17, 2026 · 110 Washington Avenue 2309, Miami Beach FL 33139
1 bd · 1.5 ba · 826 sq ft · $726/sq ft · 25 days on market · 98.5% of list priceSold $2,325,000
Closed Aug 14, 2026 · 300 S Pointe Drive 3402, Miami Beach FL 33139
2 bd · 2.5 ba · 1,960 sq ft · $1,186/sq ft · 228 days on market · 89.8% of list priceSold $1,675,000
Closed Aug 5, 2026 · 90 Alton Road 902, Miami Beach FL 33139
2 bd · 2 ba · 1,130 sq ft · $1,482/sq ft · 121 days on market · 100% of list priceSold $985,000
Closed Jul 31, 2026 · 6799 Collins Avenue CPH06, Miami Beach FL 33141
2 bd · 2 ba · 1,035 sq ft · $952/sq ft · 163 days on market · 89.5% of list priceSold $620,000
Closed Jul 31, 2026 · 465 Ocean Drive 1102, Miami Beach FL 33139
1 bd · 1 ba · 665 sq ft · $932/sq ft · 105 days on market · 89.2% of list priceSold $380,000
Closed Jul 31, 2026 · 401 Ocean Drive 324, Miami Beach FL 33139
1 bd · 1 ba · 655 sq ft · $580/sq ft · 6 days on market · 92.7% of list priceSold $920,000
Closed Jul 31, 2026 · 100 Meridian Avenue 233, Miami Beach FL 33139
2 bd · 2 ba · 940 sq ft · $979/sq ft · 54 days on market · 92.1% of list priceSold $3,100,000
Closed Jul 28, 2026 · 300 S Pointe Drive 1001, Miami Beach FL 33139
3 bd · 2.5 ba · 2,340 sq ft · $1,325/sq ft · 16 days on market · 96.9% of list priceSold $472,000
Closed Jul 17, 2026 · 401 Ocean Drive 421, Miami Beach FL 33139
1 bd · 1 ba · 655 sq ft · $721/sq ft · 139 days on market · 94.6% of list priceSold $1,025,000
Closed Jul 17, 2026 · 90 Alton Road TH-1, Miami Beach FL 33139
2 bd · 2.5 ba · 1,410 sq ft · $727/sq ft · 130 days on market · 86.4% of list priceSold $1,375,000
Closed Jul 15, 2026 · 500 Alton Road 2004, Miami Beach FL 33139
1 bd · 1.5 ba · 1,000 sq ft · $1,375/sq ft · 160 days on market · 94.8% of list priceSold $625,000
Closed Jul 15, 2026 · 101 Ocean Drive 1003, Miami Beach FL 33139
0 bd · 1 ba · 400 sq ft · $1,563/sq ft · 132 days on market · 96.2% of list priceSold $675,000
Closed Jul 15, 2026 · 90 Alton Road 1405, Miami Beach FL 33139
1 bd · 1 ba · 740 sq ft · $912/sq ft · 10 days on market · 96.6% of list priceSold $3,725,000
Closed Jul 7, 2026 · 1 Collins Avenue 402, Miami Beach FL 33139
3 bd · 3.5 ba · 2,045 sq ft · $1,822/sq ft · 36 days on market · 88.8% of list priceSold $3,150,000
Closed Jul 6, 2026 · 500 Alton Road 901, Miami Beach FL 33139
3 bd · 3.5 ba · 2,178 sq ft · $1,446/sq ft · 115 days on market · 98.6% of list priceSold $2,200,000
Closed Jul 1, 2026 · 400 S Pointe Drive 1910, Miami Beach FL 33139
2 bd · 2 ba · 1,559 sq ft · $1,411/sq ft · 107 days on market · 93.6% of list price
Reading South of Fifth, Miami Beach Sales
Each sale shows the closing price, the closing date, the price per square foot and the days on market. Compare the closing price with the last asking price to see how much room there was to negotiate, and compare days on market across sales to see which homes were priced right from the start.
Recent Sales Are What a Valuation Is Built On
An estimate of your home's value starts from the closed sales closest to it in place, size, age and features, adjusted for what is different. These are those sales. Request a free valuation and a BreakThru broker prepares it from the ones that match your home, or ask for a comparative market analysis before you list.
What Homes in South of Fifth Are Selling For
69 homes closed in South of Fifth in the last 180 days at a median of $1,025,000, or $1,044 per square foot, after 87 days on the market on average, and sellers achieved 94.5% of asking. The median is down 21.2% on the same period a year earlier. With a small number of sales a single large or small home can move a median, which is why a valuation works from the individual closings rather than from this figure.
What Buyers Pay For in South of Fifth
South of Fifth, or SoFi, is the southern tip of Miami Beach below 5th Street, bounded by the ocean, Government Cut and Biscayne Bay. South Pointe Park and its pier, the Miami Beach Marina and the cruise ships passing through Government Cut are part of daily life. Homes run from boutique 1960s and 1970s buildings such as Golden Dreams and The Presidential on Ocean Drive to the towers built from the late 1990s on, among them Portofino Tower, Murano Grande, ICON South Beach and Continuum, and newer buildings such as Five Park. Monthly fees vary widely, so compare what each association covers. Those are the things a South of Fifth buyer compares from one home to the next, and they are what separate a sale at the top of the range from one at the bottom.
South of Fifth Against the Miami Beach Average
A Miami Beach-wide figure blends every neighborhood, every property type and every condition. South of Fifth has its own buyers and its own price range, so a home here is valued against South of Fifth closings first and against the nearest comparable streets only when there are too few. There are 170 homes for sale in South of Fifth today at a median asking price of $1,337,500, about 14.8 months of supply: that is the competition a new listing is priced against.
How to Get Your South of Fifth Home Value
Enter your address on this page. A BreakThru Realty broker pulls the South of Fifth closings that match your home, adjusts them for size, condition, lot and view, and calls you within one business day with a written value range and the sales behind it. It is free and carries no obligation, and it extends into a full comparative market analysis and a net proceeds estimate if you are thinking of listing.
South of Fifth Home Values: Frequently Asked Questions
- How much is my house worth in South of Fifth?
- Homes in South of Fifth closed at a median of $1,025,000 in the last 180 days ($1,044 per square foot), but your value comes from the individual South of Fifth closings that match your home's size, lot, condition and view. Enter your address on this page and a broker sends you a written range with the sales behind it, free.
- What is the price per square foot in South of Fifth?
- The median sold price per square foot in South of Fifth over the last 180 days is $1,044, against $1,242 for the homes currently listed. Price per square foot falls as homes get larger and rises sharply with water, view and renovation, so use it to compare similar homes, not to price one.
- How fast do homes sell in South of Fifth?
- Homes that closed in South of Fifth in the last 180 days took 87 days on average to go under contract, and there are about 14.8 months of supply on the market. Correctly priced homes sell faster than the average, because the average includes every listing that needed a price reduction first.
- Where can I see what sold recently in South of Fifth?
- The newest South of Fifth closings are on this page with the sale price and days on market for each, and the full six months are on the South of Fifth recent sales page linked below. They come straight from BeachesMLS and update daily.
Selling in South of Fifth? Your Buyer May Already Be Looking.
The closings on this page are what your home's value is built on. BreakThru Realty works with hundreds of prequalified buyers searching for properties. Request a review and a broker prices your home from these sales, checks it against the buyers on file and tells you what the records show.
- A value range built from comparable South of Fifth, Miami Beach sales, with the reasoning
- Whether a buyer already working with BreakThru Realty is looking for a property like yours
- The plan that reaches the rest of the market if no buyer on file fits
- An estimate of your selling costs and what you would keep after closing
- Your timing, privacy and goals, worked through before anything is listed
Selling in Miami Beach?
See what your home is worth from recent Miami Beach sales, the days on market and today's buyer demand. See what my home would sell for.
Buying in Miami Beach?
Every home, condo and townhome for sale in Miami Beach, straight from the MLS and updated through the day. Find my Miami Beach home.
Investing in Miami Beach?
Multifamily, rental and value add property in Miami Beach, with the taxes, association fees and price history on every listing. Evaluate Miami Beach investments.
More in South of Fifth
Nearby Miami Beach Neighborhoods
More Miami Beach Real Estate
- Miami Beach real estate guide
- Miami Beach luxury homes with price reductions
- Miami Beach penthouses for sale, by building
- Miami Beach Waterfront Homes & Condos for Sale
- Miami Beach Single-Family Homes for Sale
- Miami Beach Condos for Sale
- Sell your Miami Beach home
- Recently sold homes in Miami Beach
- Cost to sell a house in Miami Beach
Miami Beach Homes by Price Range
- Miami Beach homes for sale from $390K to $400K
- Miami Beach homes for sale from $400K to $500K
- Miami Beach homes for sale from $500K to $600K
- Miami Beach homes for sale from $600K to $700K
- Miami Beach homes for sale from $700K to $800K
- Miami Beach homes for sale from $800K to $900K
- Miami Beach homes for sale from $900K to $1M
- Miami Beach homes for sale from $1M to $5M
- Miami Beach homes for sale from $5M to $10M
- Miami Beach homes for sale from $10M to $15M
- Miami Beach homes for sale from $15M to $20M
- Miami Beach homes for sale from $20M to $25M
- Miami Beach homes for sale from $25M to $30M
- Miami Beach homes for sale from $30M to $35M
- Miami Beach homes for sale from $35M to $40M
- Miami Beach homes for sale from $40M to $45M
- Miami Beach homes for sale from $45M to $50M
- Miami Beach homes for sale from $50M to $55M
- Miami Beach homes for sale from $55M to $60M
- Miami Beach homes for sale from $60M to $65M
- Miami Beach homes for sale from $65M to $70M
- Miami Beach homes for sale from $70M to $75M
- Miami Beach homes for sale from $75M to $80M
- Miami Beach homes for sale from $80M to $85M
- Miami Beach homes for sale from $85M to $90M
- Miami Beach homes for sale from $90M to $95M
- Miami Beach homes for sale from $95M to $100M
- Miami Beach homes for sale $100M and up
Miami Beach housing market report · Miami Beach Rentals: Homes & Apartments for Rent