BreakThru Realty Weston Housing Market Report
In the 90 days to November 8, 2026, the median single-family home in Weston sold for $862,500 and the median condo or townhome for $400,000; 322 homes and condos are for sale. By months of inventory, single-family homes are a balanced market and condos and townhomes a buyer's market. BreakThru Realty analyzes BeachesMLS data daily to track home prices, inventory, sales, days on market and market direction in Weston, Florida; nothing here is typed by hand.
Weston Housing Market: Key Figures
- The median single-family home in Weston sold for $862,500 over the last 90 days, -1.7% against the same period a year earlier.
- The median condo or townhome sold for $400,000, +8.1% year over year.
- Single-family homes that sold averaged 66 days on the market; condos and townhomes 98 days.
- With 4.8 months of inventory, single-family homes are a balanced market; condos and townhomes, at 9 months, are a buyer's market.
- 322 homes and condos were for sale in Weston on November 8, 2026.
Weston Market at a Glance
Updated November 8, 2026 from BeachesMLS.
- 322homes & condos for sale
- 25new listings this week
- 101under contract
- 112waterfront listings
- 54luxury listings ($1,500,000+)
- 44sold in the last 30 days
Newest Weston Homes for Sale
The 30 newest homes, condos and townhomes on the market in Weston, straight from BeachesMLS. The 30 listings on this page run from $419,000 to $7,250,000, with a median of $837,000, about $414 per square foot, and they have been listed a median of 5 days.
- The communities with the most listings here are Weston Estates (3), Country Isles (2), Mariposa Pointe at Weston (2), Sector 1 Boundary (2) and Sectors 8 9 and (2), 11 of the 30; the others are spread across 19 more communities.
- By type: 20 single-family homes, 5 condos and 5 townhomes and villas.
- Bedrooms run from 2 to 6, a median of 4; they were built between 1973 and 2021, a median of 1998, and 3 in the last ten years.
- 12 of the 30 have a pool, and 9 are on the water.
- They sit in 4 ZIP codes: 33326, 33327, 33331 and 33332.
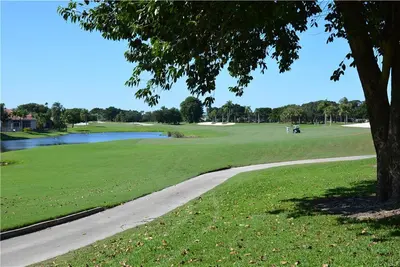 $739,999
2853 Kinsington Circle 17-1, Weston FL 33332
3 bd · 2 ba · 1,795 sq ft · Condominium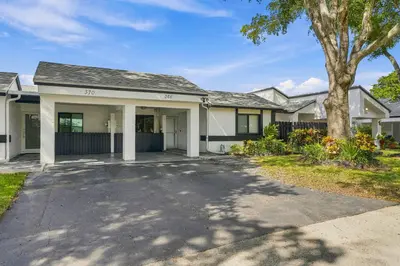 $475,000
366 FAIRWAY Circle 14, Weston FL 33326
3 bd · 2 ba · 1,500 sq ft · Condominium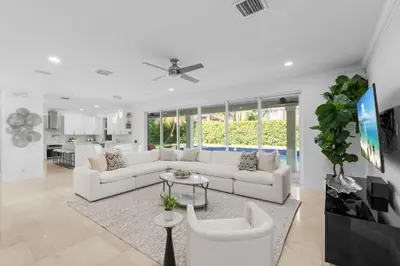 $1,645,000
1879 HIDDEN TRAIL Lane, Weston FL 33327
6 bd · 5 ba · 3,894 sq ft · Single Family Residence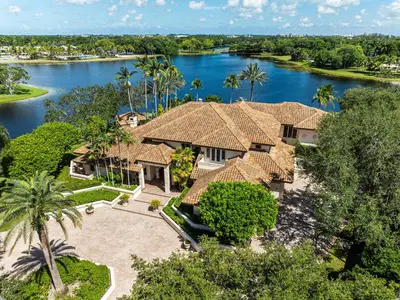 $7,250,000
2696 Boot Lane, Weston FL 33331
5 bd · 7 ba · 7,676 sq ft · Single Family Residence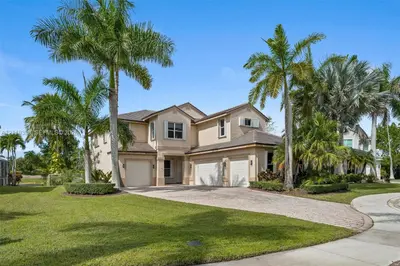 $1,780,000
1887 Harbor View Circle, Weston FL 33327
6 bd · 4 ba · 3,479 sq ft · Single Family Residence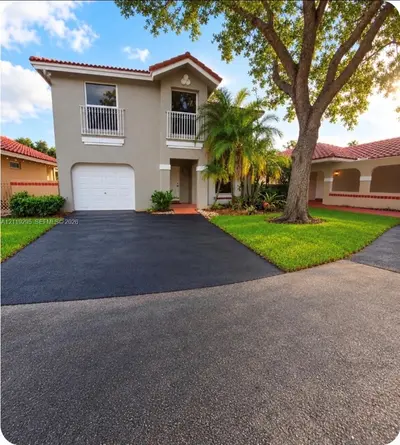 $550,000
1292 Seagrape Circle, Weston FL 33326
3 bd · 2 ba · 1,502 sq ft · Single Family Residence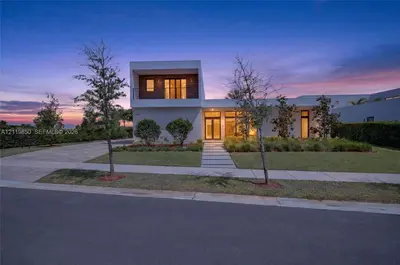 $3,200,000
16709 Botaniko Drive, Weston FL 33326
5 bd · 6.5 ba · 5,368 sq ft · Single Family Residence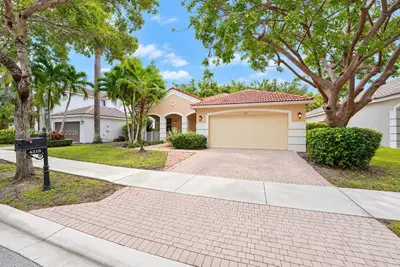 $859,000
4319 Fox Hollow, Weston FL 33331
4 bd · 2.5 ba · 2,116 sq ft · Single Family Residence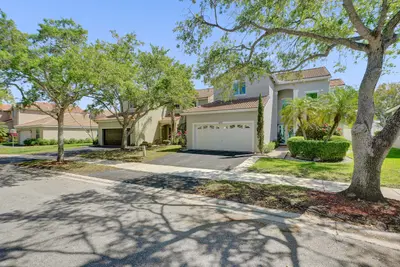 $873,900
873 STANTON Drive, Weston FL 33326
5 bd · 3.5 ba · 2,368 sq ft · Single Family Residence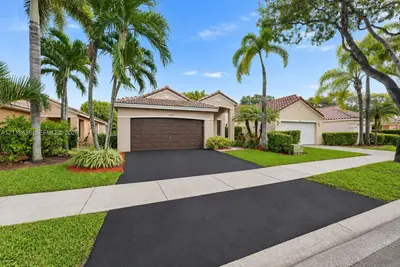 $699,000
4305 Mahogany Ridge Drive, Weston FL 33331
3 bd · 2 ba · 1,542 sq ft · Single Family Residence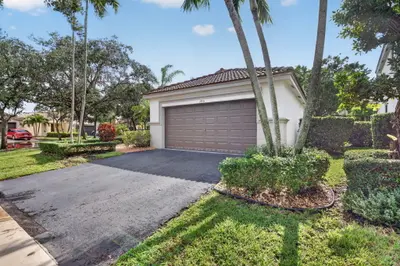 $649,000
1455 Sunset Way, Weston FL 33327
3 bd · 2 ba · 1,420 sq ft · Single Family Residence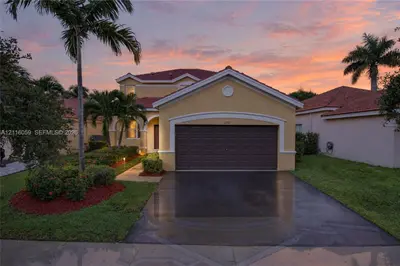 $885,000
1247 Chinaberry Drive, Weston FL 33327
4 bd · 2.5 ba · 2,240 sq ft · Single Family Residence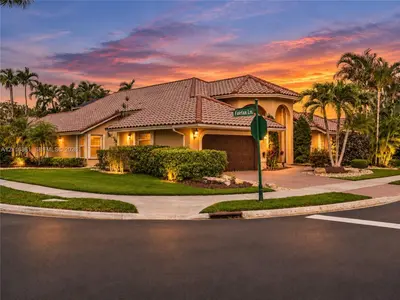 $1,150,000
1175 Fairfax Lane, Weston FL 33326
4 bd · 3.5 ba · 2,414 sq ft · Single Family Residence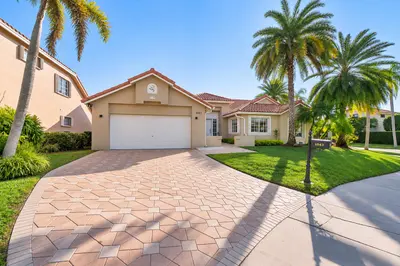 $730,000
1043 LAGUNA SPRINGS Drive, Weston FL 33326
3 bd · 2 ba · 1,751 sq ft · Single Family Residence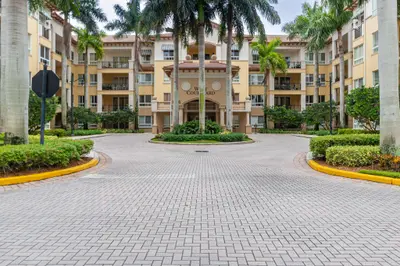 $510,000
16101 EMERALD ESTATES Drive 146, Weston FL 33331
2 bd · 2 ba · 1,290 sq ft · Condominium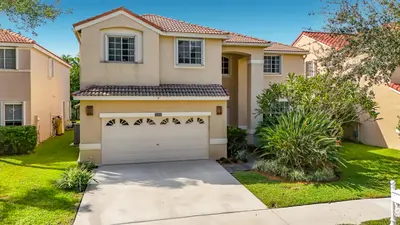 $1,080,000
534 Slippery Rock Road, Weston FL 33327
5 bd · 3.5 ba · 2,941 sq ft · Single Family Residence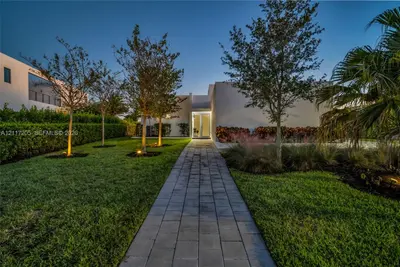 $2,589,000
16582 S Botaniko Drive, Weston FL 33326
4 bd · 5.5 ba · 3,389 sq ft · Single Family Residence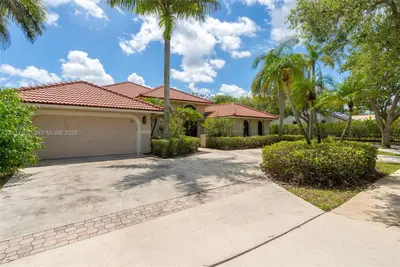 $1,099,000
1051 Deerpath Court, Weston FL 33326
5 bd · 3 ba · 2,822 sq ft · Single Family Residence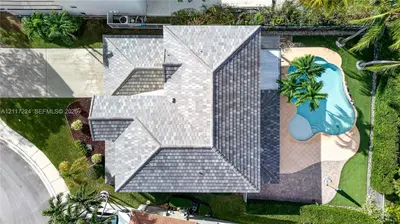 $1,115,000
4467 Fox Glove Lane, Weston FL 33331
4 bd · 3 ba · 2,536 sq ft · Single Family Residence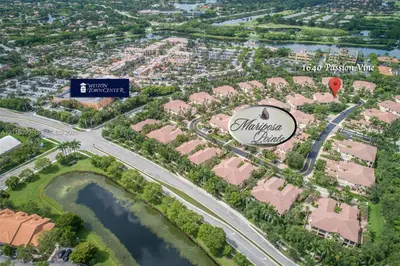 $683,000
, Weston FL 33326
3 bd · 2 ba · 1,560 sq ft · Condominium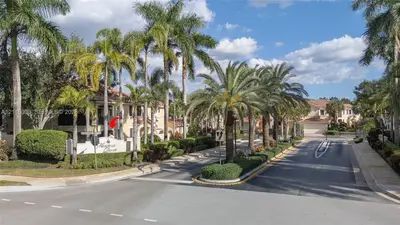 $569,000
1505 Passion Vine Circle 1-1, Weston FL 33326
3 bd · 2 ba · 1,560 sq ft · Townhouse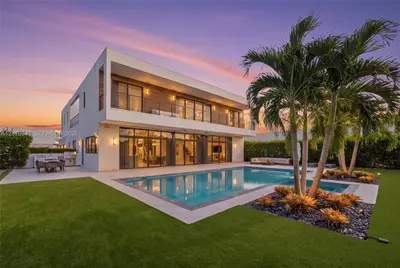 $3,785,000
16642 S Botaniko Drive, Weston FL 33326
5 bd · 9.5 ba · 6,715 sq ft · Single Family Residence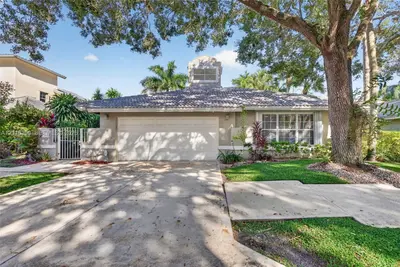 $815,000
2150 Cove Lane, Weston FL 33326
3 bd · 3 ba · 2,044 sq ft · Single Family Residence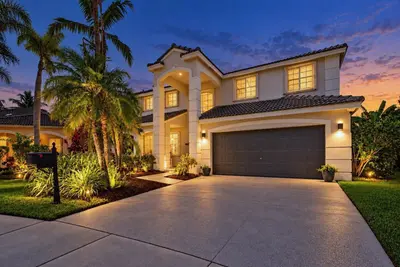 $1,050,000
4132 BOSTON Court, Weston FL 33331
4 bd · 2.5 ba · 2,533 sq ft · Single Family Residence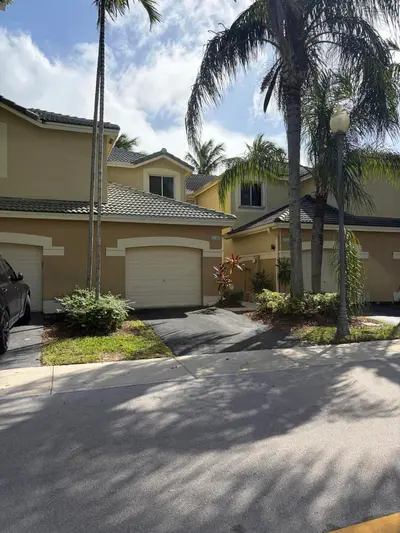 $550,000
2158 PASA VERDE Lane 2158, Weston FL 33327
3 bd · 2.5 ba · 1,461 sq ft · Townhouse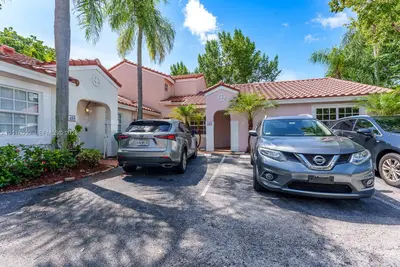 $479,500
1462 Springside Drive, Weston FL 33326
2 bd · 2 ba · 913 sq ft · Villa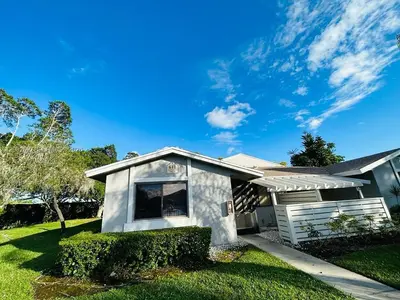 $419,000
611 Racquet Club Road 1, Weston FL 33326
3 bd · 2 ba · 1,271 sq ft · Villa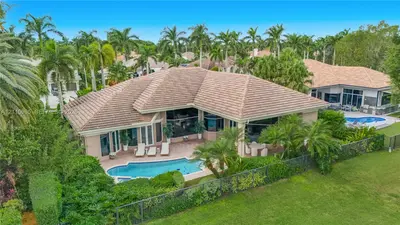 $2,700,000
2508 Princeton Court, Weston FL 33327
5 bd · 4.5 ba · 4,085 sq ft · Single Family Residence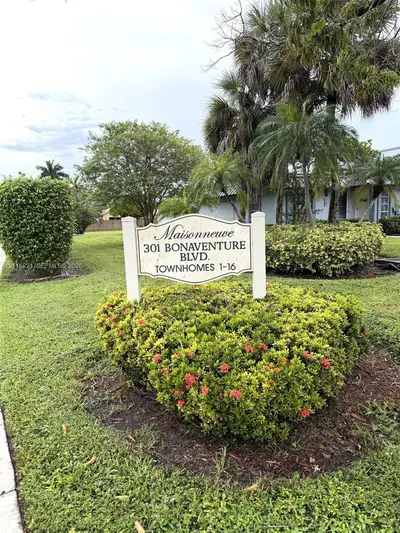 $425,000
301 Bonaventure Boulevard 15, Weston FL 33326
2 bd · 2 ba · 1,160 sq ft · Condominium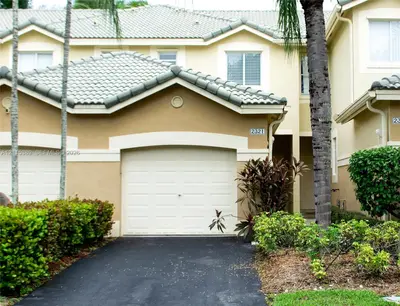 $450,000
2321 Cordoba Bend, Weston FL 33327
2 bd · 2.5 ba · 1,155 sq ft · Townhouse
| Single-family homes | Condos & townhomes | |
|---|---|---|
| Active listings | 186 | 129 |
| Median list price | $1,149,500 | $385,000 |
| Median list price per sq ft | $438/sq ft | $298/sq ft |
| Average days on market | 92 days | 103 days |
| Sold in the last 90 days | 116 | 43 |
| Median sold price (90 days) | $862,500 | $400,000 |
| Sale price as % of list price | 96.4% | 96.2% |
| Months of inventory | 4.8 months | 9 months |
| Median sold price vs. a year ago | -1.7% | +8.1% |
Source: BeachesMLS. Active listings as of November 8, 2026; sold figures cover closings in the last 90 days, compared with the same 90 days one year earlier. Not an appraisal. How these figures are calculated.
Weston Home Sales by Month
Closed residential sales in Weston by closing month, from BeachesMLS. The current month is partial until it closes.
| Month | Closed sales | Median sold price | Median $/sq ft | Avg days to sell | Sale-to-list |
|---|---|---|---|---|---|
| Dec 2025 | 60 | $802,500 | $363/sq ft | 73 days | 96.6% |
| Jan 2026 | 62 | $645,000 | $388/sq ft | 81 days | 96.7% |
| Feb 2026 | 54 | $755,000 | $374/sq ft | 67 days | 95.9% |
| Mar 2026 | 56 | $706,250 | $375/sq ft | 93 days | 96.2% |
| Apr 2026 | 77 | $750,000 | $379/sq ft | 64 days | 95.8% |
| May 2026 | 83 | $778,000 | $378/sq ft | 97 days | 95.7% |
| Jun 2026 | 74 | $887,500 | $388/sq ft | 52 days | 96.1% |
| Jul 2026 | 65 | $950,000 | $398/sq ft | 65 days | 96% |
| Aug 2026 | 58 | $748,750 | $396/sq ft | 79 days | 96.7% |
| Sep 2026 | 62 | $817,300 | $392/sq ft | 71 days | 96.5% |
| Oct 2026 | 50 | $663,000 | $369/sq ft | 85 days | 95.8% |
| Nov 2026 (to date) | 5 | $727,500 | $367/sq ft | 32 days | 96.7% |
Weston Inventory Over Time
Active listings, new listings and homes under contract in Weston, from BreakThru Realty's daily snapshots of BeachesMLS (recorded since 2026-09-16).
| Date | Active listings | New this week | Under contract | Sold in 30 days | Median list (single-family) | Median list (condos) |
|---|---|---|---|---|---|---|
| 2026-10-07 | 320 | 21 | 84 | 55 | $1,170,000 | $360,000 |
| 2026-10-08 | 322 | 19 | 83 | 55 | $1,182,500 | $360,000 |
| 2026-10-10 | 316 | 16 | 89 | 50 | $1,195,000 | $365,000 |
| 2026-10-11 | 316 | 13 | 89 | 49 | $1,195,000 | $365,000 |
| 2026-10-12 | 318 | 15 | 90 | 46 | $1,182,500 | $365,000 |
| 2026-10-13 | 322 | 19 | 89 | 48 | $1,170,000 | $365,000 |
| 2026-10-14 | 325 | 21 | 89 | 50 | $1,164,950 | $370,000 |
| 2026-10-15 | 325 | 21 | 88 | 53 | $1,156,950 | $368,500 |
| 2026-10-16 | 323 | 20 | 89 | 50 | $1,156,950 | $366,750 |
| 2026-10-17 | 323 | 22 | 91 | 50 | $1,164,950 | $365,000 |
| 2026-10-18 | 324 | 21 | 92 | 49 | $1,170,000 | $365,000 |
| 2026-10-19 | 325 | 19 | 90 | 47 | $1,154,000 | $365,000 |
| 2026-10-20 | 326 | 22 | 88 | 51 | $1,154,000 | $365,000 |
| 2026-10-21 | 326 | 19 | 89 | 54 | $1,156,950 | $370,000 |
| 2026-10-23 | 327 | 20 | 90 | 53 | $1,164,950 | $370,500 |
| 2026-10-24 | 325 | 21 | 90 | 57 | $1,159,900 | $370,500 |
| 2026-10-25 | 325 | 18 | 89 | 52 | $1,159,900 | $370,500 |
| 2026-10-26 | 322 | 16 | 90 | 49 | $1,156,950 | $370,500 |
| 2026-10-27 | 323 | 17 | 89 | 53 | $1,152,000 | $370,000 |
| 2026-10-28 | 322 | 17 | 90 | 55 | $1,150,000 | $370,000 |
| 2026-10-29 | 323 | 16 | 90 | 52 | $1,149,500 | $370,000 |
| 2026-10-30 | 323 | 17 | 89 | 56 | $1,130,000 | $371,000 |
| 2026-10-31 | 326 | 19 | 88 | 48 | $1,130,000 | $375,000 |
| 2026-11-01 | 329 | 20 | 87 | 43 | $1,127,500 | $379,000 |
| 2026-11-02 | 329 | 19 | 90 | 44 | $1,125,000 | $385,450 |
| 2026-11-03 | 324 | 23 | 94 | 45 | $1,149,500 | $387,950 |
| 2026-11-05 | 322 | 22 | 97 | 45 | $1,149,500 | $390,450 |
| 2026-11-06 | 326 | 23 | 98 | 44 | $1,139,500 | $378,000 |
| 2026-11-07 | 324 | 26 | 98 | 45 | $1,149,000 | $378,000 |
| 2026-11-08 | 322 | 25 | 101 | 44 | $1,149,500 | $385,000 |
Weston Rental Market at a Glance
Updated November 8, 2026 from BeachesMLS.
- 162homes for rent
- $3,800/momedian asking rent
- 12new rentals this week
- 51leased in the last 30 days
| Houses & townhomes | Condos & apartments | |
|---|---|---|
| Active rentals | 122 | 40 |
| Median asking rent | $4,050/mo | $2,500/mo |
| Median rent per sq ft | $2.43/sq ft | $2.08/sq ft |
| Average days on market | 52 days | 60 days |
| Leased in the last 90 days | 170 | 38 |
| Median leased rent (90 days) | $3,800/mo | $2,400/mo |
| Median leased rent vs. a year ago | -5% | 0% |
Source: BeachesMLS. Asking rents are active rentals as of November 8, 2026; leased rents cover leases signed in the last 90 days, compared with the same 90 days one year earlier. Not an appraisal.
Home Prices in Weston
Over the last 90 days the median single-family home in Weston sold for $862,500 ($414 per square foot) and the median condo or townhome for $400,000 ($296 per square foot). Against the same 90 days a year earlier that is -1.7% for single-family homes and +8.1% for condos. Homes on the market now are asking a median $1,149,500 (single-family) and $385,000 (condos and townhomes). Medians describe the middle of the market; a waterfront estate and a garden condo pull in opposite directions, which is why the two segments are reported separately.
Inventory and the Pace of Sales
322 homes and condos are for sale in Weston today, 25 of them listed in the last seven days, and 101 are under contract. 44 sales closed in the last 30 days. Single-family homes carry 4.8 months of inventory and condos 9 months, which makes the single-family side a balanced market: under four months favours sellers, over six favours buyers. Active single-family listings have been on the market 92 days on average, condos 103 days.
Single-Family Homes vs. Condos and Townhomes
The two halves of the Weston market move differently. Single-family sellers achieved 96.4% of their asking price on the typical sale in the last 90 days after 66 days on market; condo and townhome sellers achieved 96.2% after 98 days. 116 single-family homes and 43 condos and townhomes closed in that window. Condo pricing also carries the building's fees, reserves and rental rules, so a low list price in an older tower is not the same deal as a low list price on a lot.
The Last Twelve Months
706 residential sales closed in Weston over the last twelve months. The whole-market median sold price moved from $802,500 in Dec 2025 to $663,000 in Oct 2026, a change of -17.4%. The month-by-month table below shows closings, median price, price per square foot and days to sell; the current month is partial until it closes.
What These Figures Mean If You Are Selling in Weston
The figures above describe all of Weston. Your price comes from the closed sales that match your home: the same neighborhood, the same water or golf course position, the same age and condition. The sale to list ratio shows how far buyers are negotiating below asking, days on market shows how long a well priced home waits, and months of inventory shows whether buyers or sellers hold the leverage this season. Request the review below and a broker applies all three to your address before you decide on a price.
Investing in Weston
Weston is a low-turnover, owner-occupied market, which makes it steadier than the coastal condo markets but tighter on inventory. Investors focus on the townhome and villa sections in Bonaventure and around the town centre, where rental demand from families and university staff is consistent. Association rental restrictions vary and matter here, so we check them first.
Follow the Weston Market as It Moves
Leave your email on this page and BreakThru Realty sends you each new Weston listing and price drop the day it reaches the MLS, with no account needed. Owners can request a review of what their own home is worth against these figures; buyers can ask for a showing or a search.
Thinking About Selling in Weston?
The median Weston single family home closed at $862,500 in the last 90 days and took 66 days to go under contract. Prices in your neighborhood may differ from the city average. Your buyer may already be looking. BreakThru Realty works with hundreds of prequalified buyers searching for properties. Enter your address and a licensed broker prepares your selling options from the closed sales nearest your home and checks it against the buyers on file.
- A value range built from comparable Weston sales, with the reasoning
- Whether a buyer already working with BreakThru Realty is looking for a property like yours
- The plan that reaches the rest of the market if no buyer on file fits
- An estimate of your selling costs and what you would keep after closing
- Your timing, privacy and goals, worked through before anything is listed
Selling in Weston?
See what your home is worth from recent Weston sales, the days on market and today's buyer demand. See what my home would sell for.
Buying in Weston?
Every home, condo and townhome for sale in Weston, straight from the MLS and updated through the day. Find my Weston home.
Investing in Weston?
Multifamily, rental and value add property in Weston, with the taxes, association fees and price history on every listing. Evaluate Weston investments.
Weston Housing Market FAQ
- What is the median home price in Weston?
- Over the last 90 days the median sold price in Weston was $862,500 for single-family homes and $400,000 for condos and townhomes, from BeachesMLS closings as of November 8, 2026. Homes for sale now are asking a median $1,149,500 and $385,000 respectively. These figures refresh daily on this page.
- Is Weston a buyer's market or a seller's market?
- By months of inventory, the single-family side of Weston is a balanced market right now: 4.8 months of supply, with condos and townhomes at 9 months (buyer's market). Under four months of supply favours sellers, over six favours buyers, and the two segments often sit on different sides of that line in South Florida.
- How long does it take to sell a home in Weston?
- Single-family homes that closed in Weston in the last 90 days had been on the market 66 days on average, and condos and townhomes 98 days. Sellers achieved 96.4% of their asking price on the typical single-family sale and 96.2% on the typical condo sale. Well-priced homes go under contract in the first few weeks; the average is pulled up by listings that started too high.
- Are home prices in Weston going up or down?
- Over the last twelve months the whole-market median sold price in Weston moved from $802,500 (Dec 2025) to $663,000 (Oct 2026), -17.4%. Comparing the last 90 days with the same 90 days a year earlier, single-family medians are -1.7% and condo medians +8.1%. Monthly medians swing with the mix of homes that happened to close, so the direction over several months matters more than any one month.
- Are condo prices in Weston going up or down?
- The median condo or townhome in Weston closed at $400,000 in the last 90 days, up 8.1% against the same 90 days a year earlier, with 9 months of condo inventory on the market and 98 days on average to go under contract, from BeachesMLS closings as of November 8, 2026. A citywide condo median blends every building and line; what a particular condo is worth comes from the closings in its own building, its association fees and its reserve and inspection status.
- What is the median rent in Weston?
- The median asking rent in Weston is $3,800 a month across 162 active rentals: $4,050 for houses and townhomes and $2,500 for condos and apartments. The Weston rentals hub carries the full rental market table, updated daily.
- Where do these numbers come from?
- Every figure is computed from BeachesMLS: active listings are counted as of the refresh date (November 8, 2026), sold figures cover closings in the last 90 days compared with the same 90 days a year earlier, and the monthly table buckets closed sales by closing date. Statistics refresh once a day and are cached; inventory over time comes from our own daily snapshots. Nothing on this page is typed by hand, and none of it is an appraisal. BreakThru Realty's market data methodology page explains every calculation, and broker of record Tyson E. Sam reviews the method and the written guidance in this report.