BreakThru Realty Broward County Housing Market Report
In the 90 days to November 8, 2026, the median single-family home in Broward County sold for $649,000 and the median condo or townhome for $235,000; 14,761 homes and condos are for sale. By months of inventory, single-family homes are a balanced market and condos and townhomes a buyer's market. BreakThru Realty analyzes BeachesMLS data daily to track home prices, inventory, sales, days on market and market direction in Broward County, Florida; nothing here is typed by hand.
Broward County Housing Market: Key Figures
- The median single-family home in Broward County sold for $649,000 over the last 90 days, +3% against the same period a year earlier.
- The median condo or townhome sold for $235,000, -6% year over year.
- Single-family homes that sold averaged 80 days on the market; condos and townhomes 117 days.
- With 4.7 months of inventory, single-family homes are a balanced market; condos and townhomes, at 11.6 months, are a buyer's market.
- 14,761 homes and condos were for sale in Broward County on November 8, 2026.
Broward County Market at a Glance
Updated November 8, 2026 from BeachesMLS.
- 14,761homes & condos for sale
- 933new listings this week
- 2,747under contract
- 5,041waterfront listings
- 2,137luxury listings ($1,000,000+)
- 1,531sold in the last 30 days
Newest Broward County Homes for Sale
The 30 newest homes, condos and townhomes on the market in Broward County, straight from BeachesMLS. The 30 listings on this page run from $419,000 to $2,700,000, with a median of $842,000, about $471 per square foot, and they have been listed a median of 2 days.
- By type: 19 single-family homes, 8 condos, 2 townhomes and villas and 1 multifamily property.
- Bedrooms run from studios to 5, a median of 3; they were built between 1938 and 2022, a median of 1978, and 3 in the last ten years.
- 12 of the 30 have a pool, and 7 are on the water.
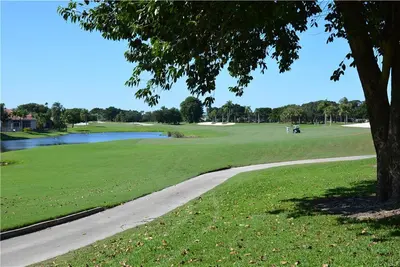 $739,999
2853 Kinsington Circle 17-1, Weston FL 33332
3 bd · 2 ba · 1,795 sq ft · Condominium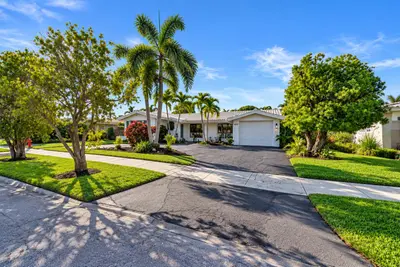 $815,000
2050 NE 59TH Place, Fort Lauderdale FL 33308
3 bd · 2 ba · 1,776 sq ft · Single Family Residence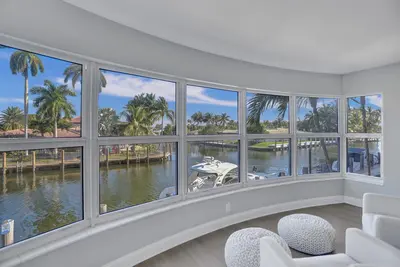 $455,000
3121 NE 51ST Street 201E, Fort Lauderdale FL 33308
2 bd · 2 ba · 1,300 sq ft · Condominium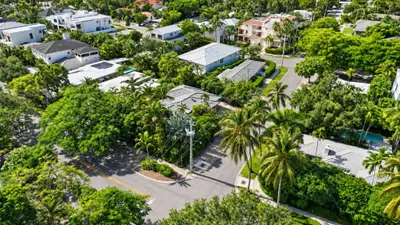 $1,325,000
645 N VICTORIA PARK Road, Fort Lauderdale FL 33304
3 bd · 2.5 ba · 1,943 sq ft · Single Family Residence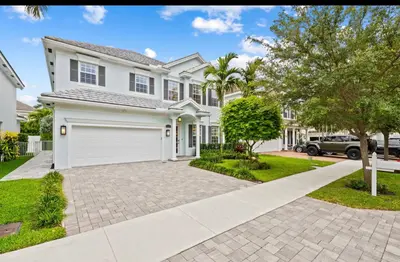 $1,625,000
1418 SW 20TH Court, Fort Lauderdale FL 33315
5 bd · 4 ba · 3,089 sq ft · Single Family Residence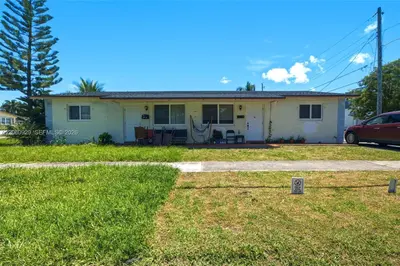 $600,000
137 NE 1st Court, Dania Beach FL 33004
0 ba · 1,674 sq ft · Duplex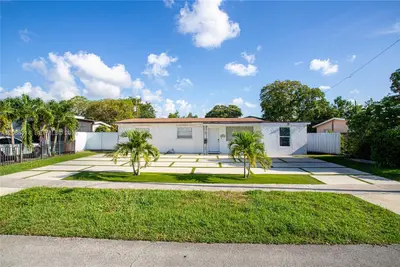 $500,000
6930 Fillmore Street, Hollywood FL 33024
4 bd · 3 ba · 1,380 sq ft · Single Family Residence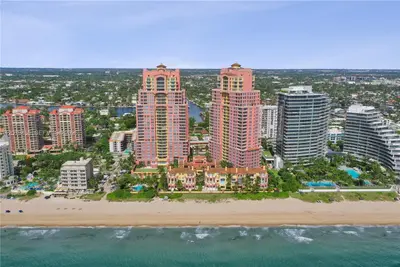 $1,899,500
2100 N Ocean Boulevard 18B, Fort Lauderdale FL 33305
3 bd · 3 ba · 2,623 sq ft · Condominium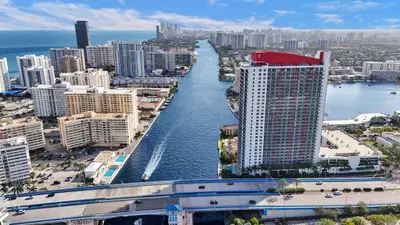 $525,000
2600 E HALLANDALE BEACH Boulevard T3210, Hallandale Beach FL 33009
2 bd · 2 ba · 1,028 sq ft · Condominium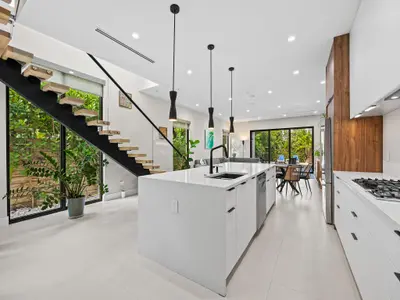 $1,500,000
1113 NE 2nd Street, Fort Lauderdale FL 33301
3 bd · 3.5 ba · 2,404 sq ft · Townhouse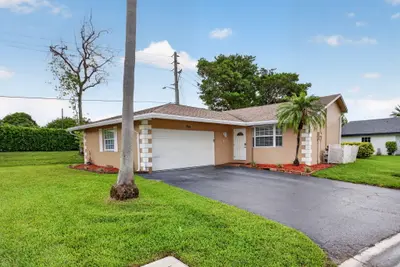 $474,900
7516 NW 88th Terrace, Tamarac FL 33321
3 bd · 2 ba · 1,428 sq ft · Single Family Residence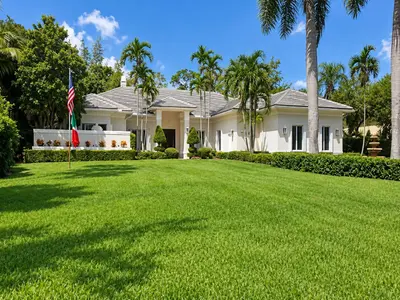 $2,199,000
5987 NW 65TH Terrace, Parkland FL 33067
4 bd · 3.5 ba · 4,493 sq ft · Single Family Residence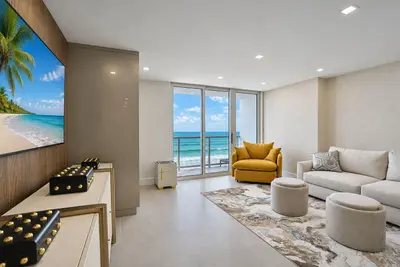 $700,000
209 N FORT LAUDERDALE BEACH Boulevard 14H, Fort Lauderdale FL 33304
0 bd · 1 ba · 570 sq ft · Condominium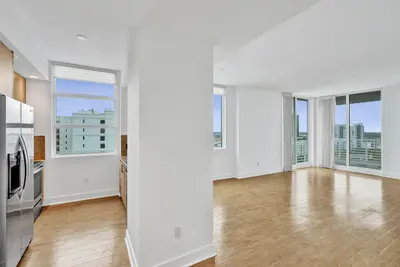 $448,000
315 NE 3rd Avenue 1201, Fort Lauderdale FL 33301
2 bd · 2.5 ba · 1,185 sq ft · Condominium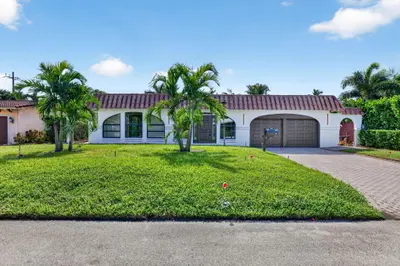 $1,189,000
2048 TROPIC Isle, Lauderdale-By-The-Sea FL 33062
3 bd · 3 ba · 2,331 sq ft · Single Family Residence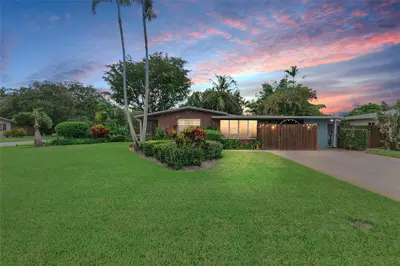 $935,000
601 NW 22ND Court, Wilton Manors FL 33311
3 bd · 2 ba · 1,620 sq ft · Single Family Residence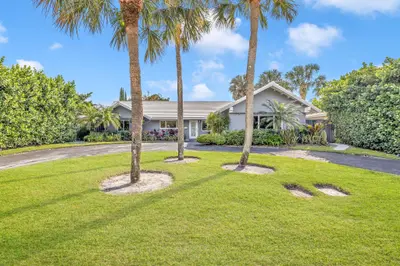 $890,000
1920 NE 57TH Street, Fort Lauderdale FL 33308
3 bd · 2 ba · 1,811 sq ft · Single Family Residence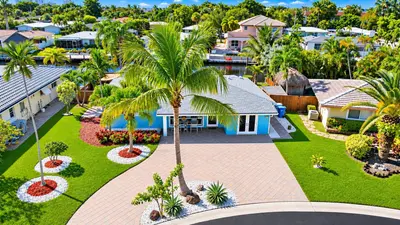 $979,000
201 SE 3RD Avenue, Pompano Beach FL 33060
3 bd · 2 ba · 1,401 sq ft · Single Family Residence$2,695,000
2711 S Ocean Drive 3404, Hollywood FL 33019
3 bd · 3.5 ba · 3,395 sq ft · Condominium$529,000
7940 NW 9th Street, Margate FL 33063
4 bd · 2 ba · 1,629 sq ft · Single Family Residence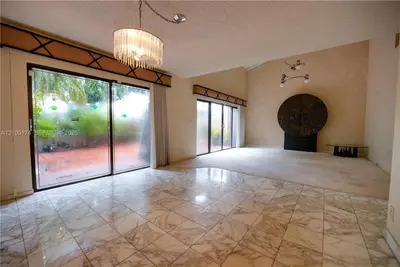 $419,000
804 Saint Andrews Road 14, Hollywood FL 33021
3 bd · 3 ba · 2,350 sq ft · Condominium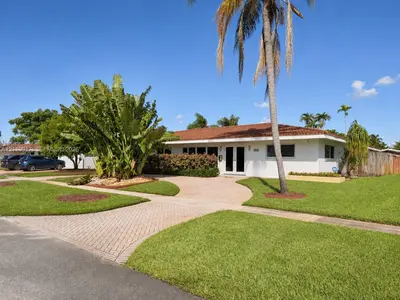 $1,380,000
4617 Garfield Street, Hollywood FL 33021
4 bd · 3 ba · 3,296 sq ft · Single Family Residence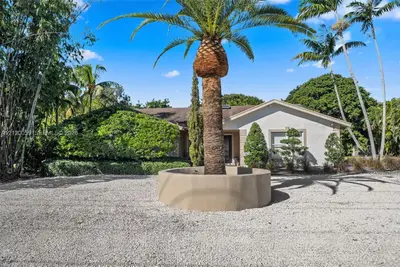 $1,495,000
6411 SW 185th Way, Southwest Ranches FL 33332
4 bd · 2 ba · 3,007 sq ft · Single Family Residence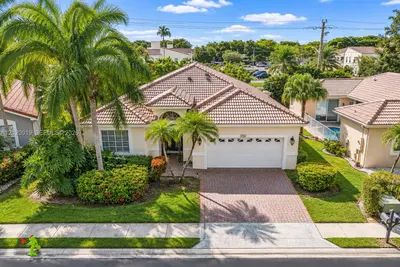 $534,999
7712 NW 78th Place, Tamarac FL 33321
3 bd · 2.5 ba · 2,182 sq ft · Single Family Residence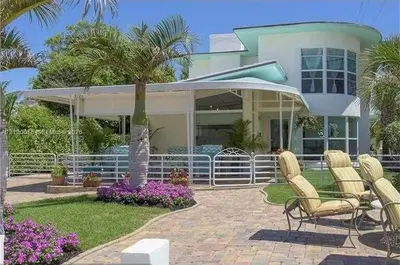 $2,700,000
3327 NE 15th Court, Fort Lauderdale FL 33304
4 bd · 3.5 ba · 1,766 sq ft · Single Family Residence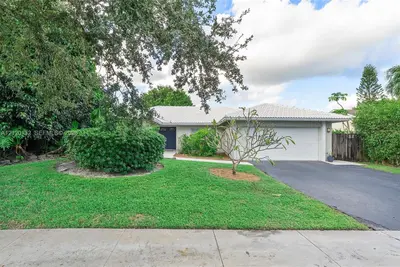 $869,000
9441 NW 15th Street, Plantation FL 33322
4 bd · 2 ba · 2,253 sq ft · Single Family Residence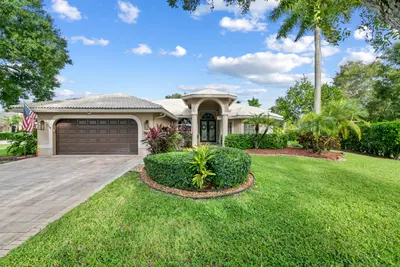 $995,000
7293 NW 68TH Drive, Parkland FL 33067
4 bd · 3 ba · 2,248 sq ft · Single Family Residence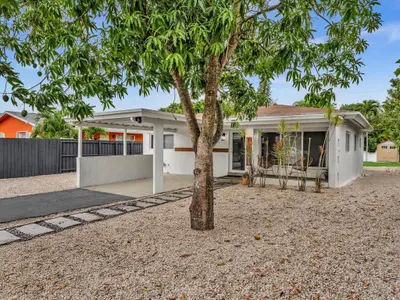 $459,900
1617 NW 7TH Avenue, Fort Lauderdale FL 33311
2 bd · 2 ba · 955 sq ft · Single Family Residence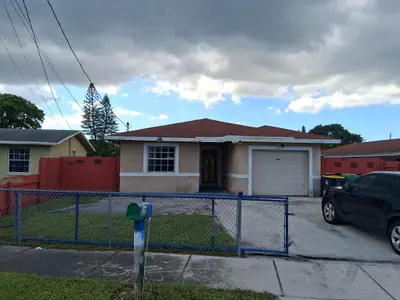 $480,000
217 NW 6th Avenue, Dania Beach FL 33004
3 bd · 2 ba · 1,505 sq ft · Single Family Residence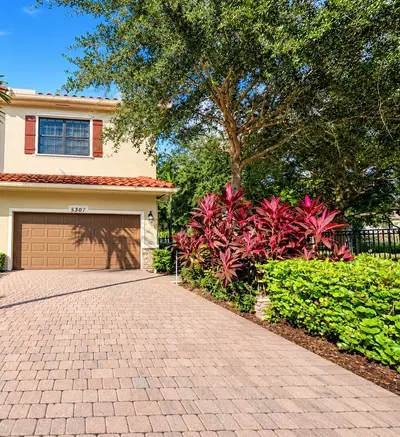 $464,000
5901 NW 56TH Court, Tamarac FL 33319
3 bd · 2.5 ba · 1,668 sq ft · Townhouse
See every Broward County home for sale with map and filters.
| Single-family homes | Condos & townhomes | |
|---|---|---|
| Active listings | 4,386 | 9,727 |
| Median list price | $779,450 | $239,000 |
| Median list price per sq ft | $418/sq ft | $241/sq ft |
| Average days on market | 178 days | 395 days |
| Sold in the last 90 days | 2,798 | 2,520 |
| Median sold price (90 days) | $649,000 | $235,000 |
| Sale price as % of list price | 97.1% | 95.5% |
| Months of inventory | 4.7 months | 11.6 months |
| Median sold price vs. a year ago | +3% | -6% |
Source: BeachesMLS. Active listings as of November 8, 2026; sold figures cover closings in the last 90 days, compared with the same 90 days one year earlier. Not an appraisal. How these figures are calculated.
Broward County Home Sales by Month
Closed residential sales in Broward County by closing month, from BeachesMLS. The current month is partial until it closes.
| Month | Closed sales | Median sold price | Median $/sq ft | Avg days to sell | Sale-to-list |
|---|---|---|---|---|---|
| Dec 2025 | 2,133 | $440,000 | $296/sq ft | 93 days | 96.4% |
| Jan 2026 | 1,570 | $435,000 | $293/sq ft | 91 days | 96% |
| Feb 2026 | 1,685 | $450,000 | $302/sq ft | 88 days | 96.3% |
| Mar 2026 | 2,291 | $450,000 | $303/sq ft | 97 days | 96.3% |
| Apr 2026 | 2,400 | $435,000 | $301/sq ft | 95 days | 96.2% |
| May 2026 | 2,307 | $450,000 | $304/sq ft | 89 days | 96.3% |
| Jun 2026 | 2,517 | $450,000 | $305/sq ft | 95 days | 96.3% |
| Jul 2026 | 2,327 | $450,000 | $297/sq ft | 86 days | 96.5% |
| Aug 2026 | 1,999 | $456,000 | $308/sq ft | 76 days | 96.8% |
| Sep 2026 | 1,923 | $450,000 | $306/sq ft | 80 days | 96.7% |
| Oct 2026 | 1,762 | $430,000 | $297/sq ft | 82 days | 96.7% |
| Nov 2026 (to date) | 266 | $450,000 | $319/sq ft | 84 days | 96.9% |
Broward County Inventory Over Time
Active listings, new listings and homes under contract in Broward County, from BreakThru Realty's daily snapshots of BeachesMLS (recorded since 2026-09-16).
| Date | Active listings | New this week | Under contract | Sold in 30 days | Median list (single-family) | Median list (condos) |
|---|---|---|---|---|---|---|
| 2026-10-07 | 14,335 | 995 | 2,931 | 1,790 | $789,999 | $244,950 |
| 2026-10-08 | 14,359 | 997 | 2,923 | 1,873 | $790,000 | $242,847 |
| 2026-10-09 | 14,400 | 1,001 | 2,902 | 1,880 | $790,000 | $242,847 |
| 2026-10-10 | 14,428 | 1,013 | 2,902 | 1,877 | $790,000 | $244,000 |
| 2026-10-11 | 14,431 | 982 | 2,907 | 1,801 | $790,000 | $243,847 |
| 2026-10-13 | 14,446 | 858 | 2,913 | 1,730 | $794,495 | $242,847 |
| 2026-10-14 | 14,462 | 851 | 2,904 | 1,802 | $795,000 | $241,450 |
| 2026-10-15 | 14,344 | 782 | 2,885 | 1,808 | $795,000 | $240,450 |
| 2026-10-16 | 14,501 | 881 | 2,882 | 1,779 | $795,000 | $240,000 |
| 2026-10-17 | 14,534 | 913 | 2,840 | 1,817 | $794,995 | $240,000 |
| 2026-10-18 | 14,547 | 924 | 2,846 | 1,768 | $795,000 | $243,847 |
| 2026-10-19 | 14,557 | 891 | 2,853 | 1,656 | $795,000 | $244,950 |
| 2026-10-20 | 14,580 | 920 | 2,842 | 1,739 | $795,000 | $244,450 |
| 2026-10-21 | 14,572 | 927 | 2,841 | 1,817 | $792,000 | $245,000 |
| 2026-10-22 | 14,622 | 917 | 2,850 | 1,797 | $790,000 | $245,000 |
| 2026-10-23 | 14,682 | 937 | 2,844 | 1,797 | $790,000 | $244,450 |
| 2026-10-24 | 14,693 | 939 | 2,853 | 1,784 | $790,000 | $243,000 |
| 2026-10-25 | 14,691 | 921 | 2,867 | 1,703 | $790,000 | $244,000 |
| 2026-10-27 | 14,688 | 809 | 2,887 | 1,624 | $790,000 | $240,900 |
| 2026-10-28 | 14,700 | 816 | 2,885 | 1,689 | $789,000 | $240,450 |
| 2026-10-29 | 14,704 | 801 | 2,886 | 1,657 | $789,450 | $240,000 |
| 2026-10-30 | 14,744 | 801 | 2,858 | 1,668 | $790,000 | $239,950 |
| 2026-10-31 | 14,754 | 804 | 2,828 | 1,553 | $789,950 | $239,950 |
| 2026-11-01 | 14,659 | 806 | 2,815 | 1,482 | $789,000 | $239,000 |
| 2026-11-02 | 14,629 | 795 | 2,819 | 1,406 | $787,000 | $239,000 |
| 2026-11-03 | 14,654 | 820 | 2,776 | 1,514 | $787,000 | $239,000 |
| 2026-11-04 | 14,616 | 807 | 2,787 | 1,592 | $782,500 | $236,691 |
| 2026-11-05 | 14,678 | 861 | 2,777 | 1,586 | $787,000 | $237,200 |
| 2026-11-06 | 14,695 | 892 | 2,770 | 1,585 | $787,000 | $239,000 |
| 2026-11-07 | 14,745 | 944 | 2,741 | 1,589 | $782,500 | $238,750 |
Home Prices in Broward County
Over the last 90 days the median single-family home in Broward County sold for $649,000 ($357 per square foot) and the median condo or townhome for $235,000 ($221 per square foot). Against the same 90 days a year earlier that is +3% for single-family homes and -6% for condos. Homes on the market now are asking a median $779,450 (single-family) and $239,000 (condos and townhomes). Medians describe the middle of the market; a waterfront estate and a garden condo pull in opposite directions, which is why the two segments are reported separately.
Inventory and the Pace of Sales
14,761 homes and condos are for sale in Broward County today, 933 of them listed in the last seven days, and 2,747 are under contract. 1,531 sales closed in the last 30 days. Single-family homes carry 4.7 months of inventory and condos 11.6 months, which makes the single-family side a balanced market: under four months favours sellers, over six favours buyers. Active single-family listings have been on the market 178 days on average, condos 395 days.
Single-Family Homes vs. Condos and Townhomes
The two halves of the Broward County market move differently. Single-family sellers achieved 97.1% of their asking price on the typical sale in the last 90 days after 80 days on market; condo and townhome sellers achieved 95.5% after 117 days. 2,798 single-family homes and 2,520 condos and townhomes closed in that window. Condo pricing also carries the building's fees, reserves and rental rules, so a low list price in an older tower is not the same deal as a low list price on a lot.
The Last Twelve Months
23,180 residential sales closed in Broward County over the last twelve months. The whole-market median sold price moved from $440,000 in Dec 2025 to $430,000 in Oct 2026, a change of -2.3%. The month-by-month table below shows closings, median price, price per square foot and days to sell; the current month is partial until it closes.
What These Figures Mean If You Are Selling in Broward County
The figures above describe all of Broward County. Your price comes from the closed sales that match your home: the same neighborhood, the same water or golf course position, the same age and condition. The sale to list ratio shows how far buyers are negotiating below asking, days on market shows how long a well priced home waits, and months of inventory shows whether buyers or sellers hold the leverage this season. Request the review below and a broker applies all three to your address before you decide on a price.
Investing in Broward County
Investors buy in Broward for rental demand that comes from the airport, the port and marine industry, downtown Fort Lauderdale employment and the universities, and for the price gap between Broward and Miami-Dade. Multifamily and small income properties concentrate in Fort Lauderdale, Hollywood, Pompano Beach, Oakland Park and Dania Beach; seasonal rental demand runs along the beach; and the foreclosure, short-sale and price-reduced pages track the listings a portal buries. Every city hub carries a rental hub with live rents and a landlord page.
Follow the Broward County Market as It Moves
Leave your email on this page and BreakThru Realty sends you each new Broward County listing and price drop the day it reaches the MLS, with no account needed. Owners can request a review of what their own home is worth against these figures; buyers can ask for a showing or a search.
Thinking About Selling in Broward County?
The median Broward County single family home closed at $649,000 in the last 90 days and took 80 days to go under contract. Prices in your neighborhood may differ from the county average. Your buyer may already be looking. BreakThru Realty works with hundreds of prequalified buyers searching for properties. Enter your address and a licensed broker prepares your selling options from the closed sales nearest your home and checks it against the buyers on file.
- A value range built from comparable Broward County sales, with the reasoning
- Whether a buyer already working with BreakThru Realty is looking for a property like yours
- The plan that reaches the rest of the market if no buyer on file fits
- An estimate of your selling costs and what you would keep after closing
- Your timing, privacy and goals, worked through before anything is listed
Selling in Broward County?
See what your home is worth from recent Broward County sales, the days on market and today's buyer demand. See what my home would sell for.
Buying in Broward County?
Every home, condo and townhome for sale in Broward County, straight from the MLS and updated through the day. Find my Broward County home.
Investing in Broward County?
Multifamily, rental and value add property in Broward County, with the taxes, association fees and price history on every listing. Evaluate Broward County investments.
Broward County Housing Market FAQ
- What is the median home price in Broward County?
- Over the last 90 days the median sold price in Broward County was $649,000 for single-family homes and $235,000 for condos and townhomes, from BeachesMLS closings as of November 8, 2026. Homes for sale now are asking a median $779,450 and $239,000 respectively. These figures refresh daily on this page.
- Is Broward County a buyer's market or a seller's market?
- By months of inventory, the single-family side of Broward County is a balanced market right now: 4.7 months of supply, with condos and townhomes at 11.6 months (buyer's market). Under four months of supply favours sellers, over six favours buyers, and the two segments often sit on different sides of that line in South Florida.
- How long does it take to sell a home in Broward County?
- Single-family homes that closed in Broward County in the last 90 days had been on the market 80 days on average, and condos and townhomes 117 days. Sellers achieved 97.1% of their asking price on the typical single-family sale and 95.5% on the typical condo sale. Well-priced homes go under contract in the first few weeks; the average is pulled up by listings that started too high.
- Are home prices in Broward County going up or down?
- Over the last twelve months the whole-market median sold price in Broward County moved from $440,000 (Dec 2025) to $430,000 (Oct 2026), -2.3%. Comparing the last 90 days with the same 90 days a year earlier, single-family medians are +3% and condo medians -6%. Monthly medians swing with the mix of homes that happened to close, so the direction over several months matters more than any one month.
- Are condo prices in Broward County going up or down?
- The median condo or townhome in Broward County closed at $235,000 in the last 90 days, down 6% against the same 90 days a year earlier, with 11.6 months of condo inventory on the market and 117 days on average to go under contract, from BeachesMLS closings as of November 8, 2026. A citywide condo median blends every building and line; what a particular condo is worth comes from the closings in its own building, its association fees and its reserve and inspection status.
- Where do these numbers come from?
- Every figure is computed from BeachesMLS: active listings are counted as of the refresh date (November 8, 2026), sold figures cover closings in the last 90 days compared with the same 90 days a year earlier, and the monthly table buckets closed sales by closing date. Statistics refresh once a day and are cached; inventory over time comes from our own daily snapshots. Nothing on this page is typed by hand, and none of it is an appraisal. BreakThru Realty's market data methodology page explains every calculation, and broker of record Tyson E. Sam reviews the method and the written guidance in this report.