BreakThru Realty Indian River County Housing Market Report
In the 90 days to November 7, 2026, the median single-family home in Indian River County sold for $370,750 and the median condo or townhome for $187,500; 574 homes and condos are for sale. By months of inventory, single-family homes are a balanced market and condos and townhomes a buyer's market. BreakThru Realty analyzes BeachesMLS data daily to track home prices, inventory, sales, days on market and market direction in Indian River County, Florida; nothing here is typed by hand.
Indian River County Housing Market: Key Figures
- The median single-family home in Indian River County sold for $370,750 over the last 90 days, -1.1% against the same period a year earlier.
- The median condo or townhome sold for $187,500, +4.2% year over year.
- Single-family homes that sold averaged 74 days on the market; condos and townhomes 72 days.
- With 5.5 months of inventory, single-family homes are a balanced market; condos and townhomes, at 8.8 months, are a buyer's market.
- 574 homes and condos were for sale in Indian River County on November 7, 2026.
Indian River County Market at a Glance
Updated November 7, 2026 from BeachesMLS.
- 574homes & condos for sale
- 40new listings this week
- 144under contract
- 143waterfront listings
- 58luxury listings ($1,000,000+)
- 84sold in the last 30 days
Newest Indian River County Homes for Sale
The 30 newest homes, condos and townhomes on the market in Indian River County, straight from BeachesMLS. The 30 listings on this page run from $69,900 to $2,500,000, with a median of $532,495, about $254 per square foot, and they have been listed a median of 6 days.
- The communities with the most listings here are Riviera Lake Subdivision (4), Sebastian Highlands (4) and Hampton Park (3), 11 of the 30; the others are spread across 19 more communities.
- By type: 25 single-family homes and 4 condos.
- Bedrooms run from 2 to 6, a median of 3; they were built between 1952 and 2026, a median of 2006, and 10 in the last ten years.
- 8 of the 30 have a pool, and 8 are on the water.
- They sit in 6 ZIP codes: 32958, 32962, 32963, 32966, 32967 and 32968.
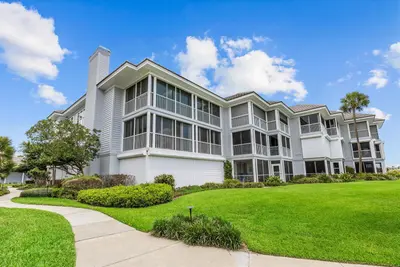 $950,000
1903 BAY Road 206, Vero Beach FL 32963
2 bd · 2 ba · 1,700 sq ft · Condominium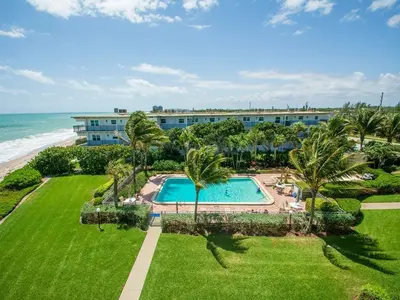 $474,900
4450 Jimmy Buffett Mem Highway 102, Vero Beach FL 32963
2 bd · 2 ba · 1,080 sq ft · Condominium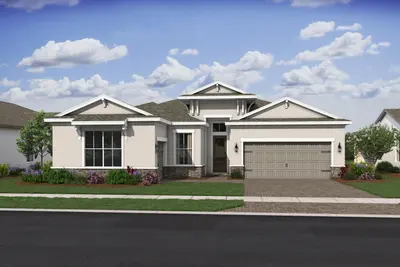 $730,216
2435 3RD Square, Vero Beach FL 32962
4 bd · 2 ba · 2,379 sq ft · Single Family Residence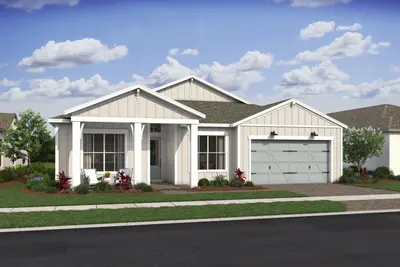 $792,326
2441 3RD Square, Vero Beach FL 32962
4 bd · 3 ba · 2,843 sq ft · Single Family Residence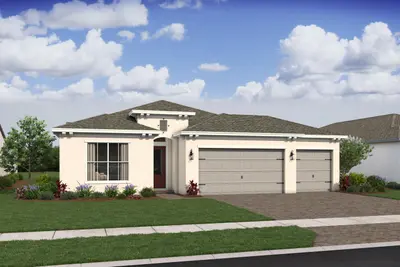 $673,567
2677 3RD Square, Vero Beach FL 32962
3 bd · 2.5 ba · 2,026 sq ft · Single Family Residence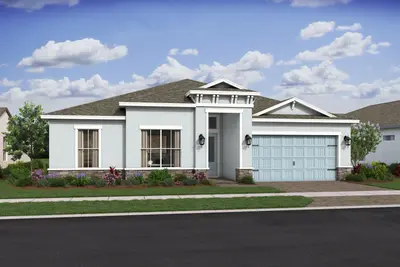 $731,206
2671 3RD Square, Vero Beach FL 32962
4 bd · 3 ba · 2,570 sq ft · Single Family Residence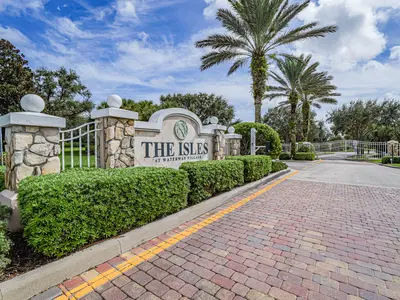 $398,000
5002 Corsica Square, Vero Beach FL 32967
2 bd · 2 ba · 1,541 sq ft · Single Family Residence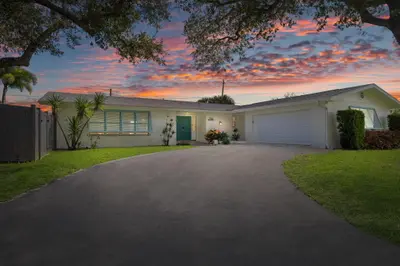 $535,000
726 10th Court, Vero Beach FL 32962
3 bd · 2 ba · 2,350 sq ft · Single Family Residence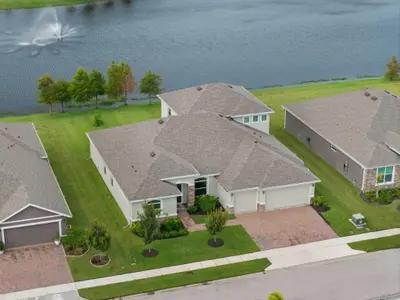 $724,900
154 52ND Square, Vero Beach FL 32968
5 bd · 4 ba · 3,492 sq ft · Single Family Residence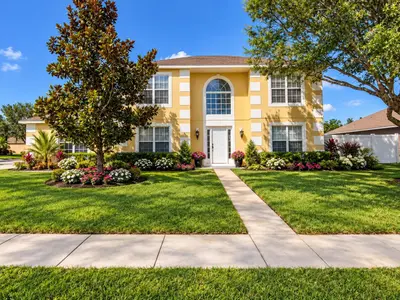 $489,000
5985 RIDGE LAKE Circle, Vero Beach FL 32967
3 bd · 2.5 ba · 2,520 sq ft · Single Family Residence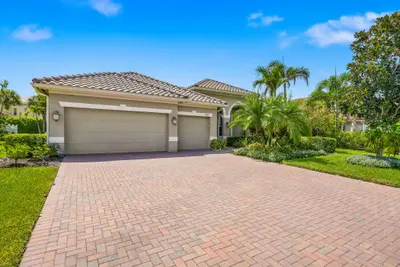 $575,000
4249 DIAMOND Square, Vero Beach FL 32967
3 bd · 3 ba · 2,626 sq ft · Single Family Residence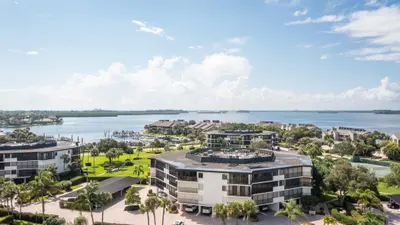 $468,000
1821 Mooringline Drive PHE, Vero Beach FL 32963
2 bd · 2 ba · 1,880 sq ft · Condominium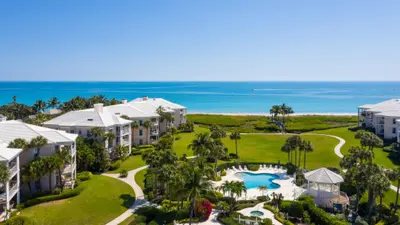 $2,500,000
1250 W Southwinds Boulevard 116, Vero Beach FL 32963
3 bd · 3.5 ba · 3,035 sq ft · Condominium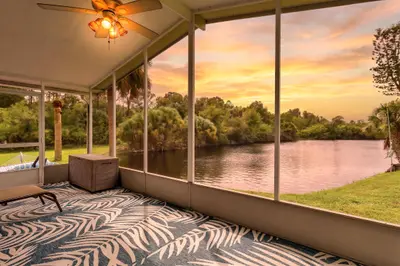 $69,900
224 Flamingo Drive, Vero Beach FL 32966
2 bd · 2 ba · 1,152 sq ft · Manufactured Home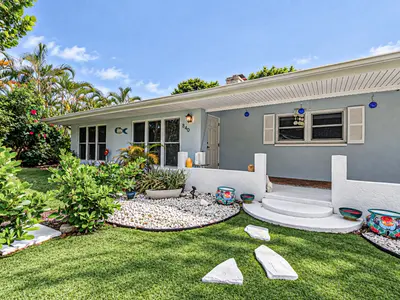 $750,000
840 SEMINOLE Lane, Indian River Shores FL 32963
3 bd · 3 ba · 1,490 sq ft · Single Family Residence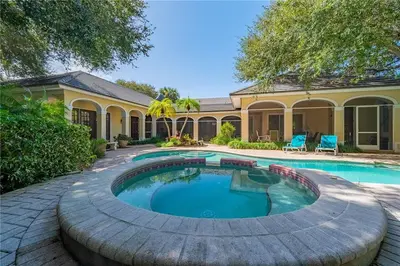 $2,400,000
101 BERMUDA BAY Lane, Indian River Shores FL 32963
4 bd · 5 ba · 4,239 sq ft · Single Family Residence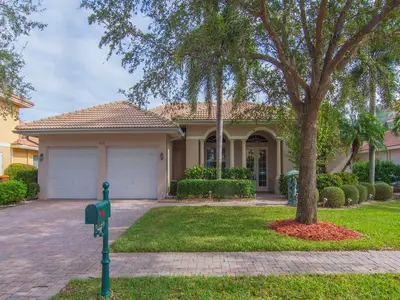 $429,900
6124 57th Court, Vero Beach FL 32967
3 bd · 3 ba · 2,447 sq ft · Single Family Residence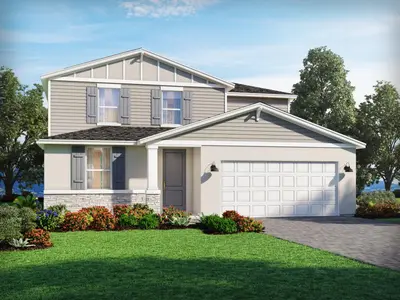 $449,990
5572 HAMPTON PARK Circle, Vero Beach FL 32966
4 bd · 2.5 ba · 2,503 sq ft · Single Family Residence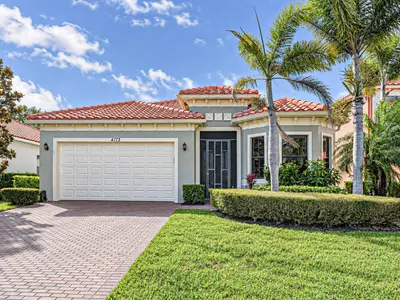 $482,000
4173 55th Street, Vero Beach FL 32967
4 bd · 3 ba · 2,303 sq ft · Single Family Residence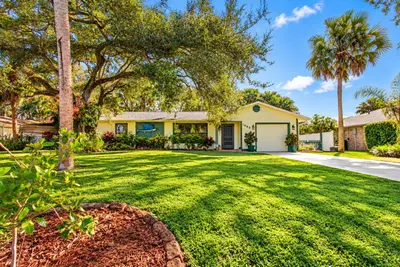 $399,000
1662 CORAL REEF Street, Sebastian FL 32958
3 bd · 2 ba · 1,376 sq ft · Single Family Residence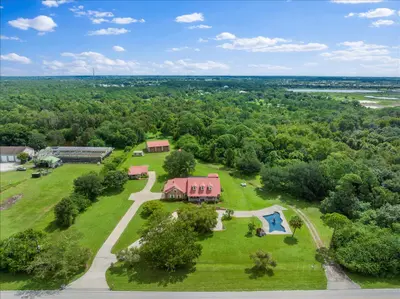 $1,300,000
930 90th Avenue, Vero Beach FL 32966
6 bd · 3 ba · 3,974 sq ft · Single Family Residence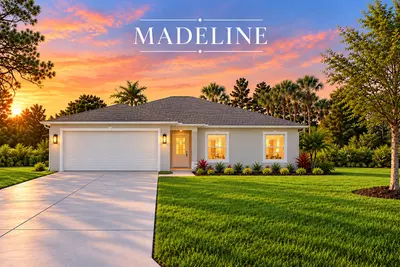 $408,000
726 Wentworth Street, Sebastian FL 32958
3 bd · 2 ba · 1,783 sq ft · Single Family Residence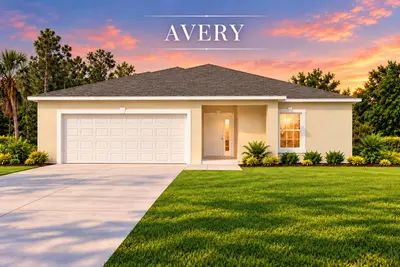 $448,000
774 Beard Avenue, Sebastian FL 32958
3 bd · 2 ba · 2,154 sq ft · Single Family Residence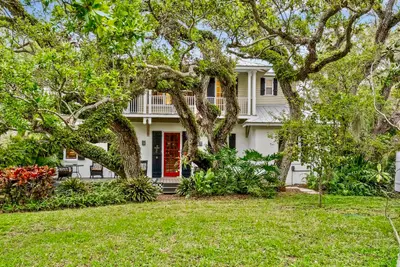 $1,699,000
3628 Rio Vista Boulevard, Vero Beach FL 32963
4 bd · 3.5 ba · 3,397 sq ft · Single Family Residence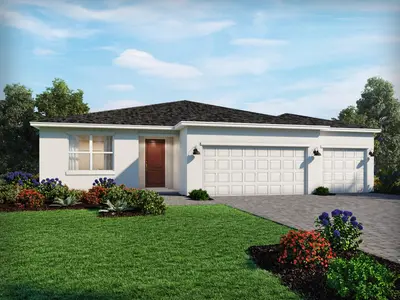 $529,990
5585 HAMPTON PARK Circle, Vero Beach FL 32966
4 bd · 3 ba · 2,493 sq ft · Single Family Residence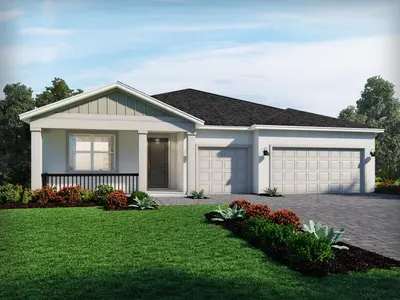 $499,990
5579 HAMPTON PARK Circle, Vero Beach FL 32966
3 bd · 2.5 ba · 2,181 sq ft · Single Family Residence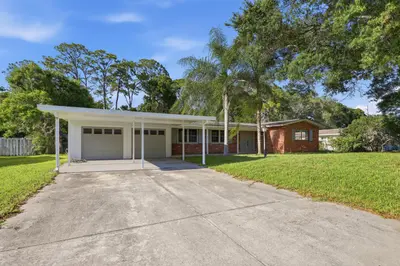 $395,000
2726 6TH Place, Vero Beach FL 32968
3 bd · 2 ba · 1,702 sq ft · Single Family Residence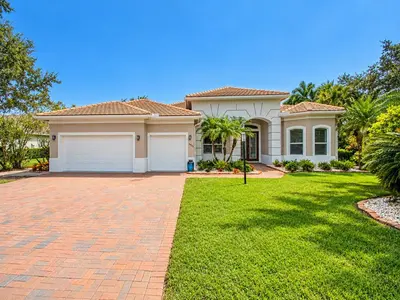 $999,900
6425 MCRAE Place, Vero Beach FL 32967
4 bd · 3.5 ba · 3,511 sq ft · Single Family Residence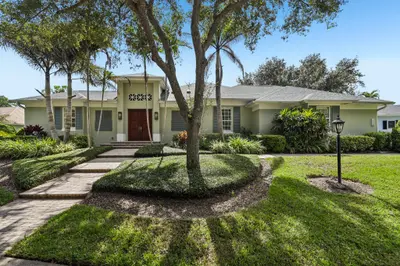 $1,398,000
1110 CAROLINA Circle, Vero Beach FL 32962
3 bd · 4.5 ba · 3,688 sq ft · Single Family Residence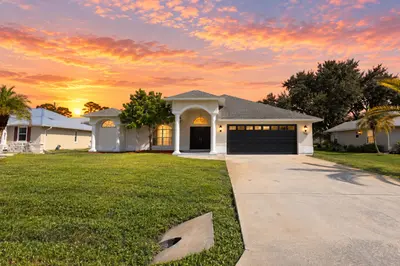 $448,000
156 Day Drive, Sebastian FL 32958
3 bd · 2 ba · 1,849 sq ft · Single Family Residence
See every Indian River County home for sale with map and filters.
| Single-family homes | Condos & townhomes | |
|---|---|---|
| Active listings | 406 | 141 |
| Median list price | $448,500 | $245,000 |
| Median list price per sq ft | $237/sq ft | $191/sq ft |
| Average days on market | 103 days | 85 days |
| Sold in the last 90 days | 222 | 48 |
| Median sold price (90 days) | $370,750 | $187,500 |
| Sale price as % of list price | 97.9% | 95.8% |
| Months of inventory | 5.5 months | 8.8 months |
| Median sold price vs. a year ago | -1.1% | +4.2% |
Source: BeachesMLS. Active listings as of November 7, 2026; sold figures cover closings in the last 90 days, compared with the same 90 days one year earlier. Not an appraisal. How these figures are calculated.
Indian River County Home Sales by Month
Closed residential sales in Indian River County by closing month, from BeachesMLS. The current month is partial until it closes.
| Month | Closed sales | Median sold price | Median $/sq ft | Avg days to sell | Sale-to-list |
|---|---|---|---|---|---|
| Dec 2025 | 100 | $363,500 | $219/sq ft | 69 days | 98.3% |
| Jan 2026 | 82 | $367,500 | $216/sq ft | 88 days | 97.2% |
| Feb 2026 | 95 | $380,000 | $215/sq ft | 95 days | 96.3% |
| Mar 2026 | 130 | $401,000 | $224/sq ft | 89 days | 97.9% |
| Apr 2026 | 134 | $344,500 | $226/sq ft | 83 days | 97.5% |
| May 2026 | 122 | $369,995 | $215/sq ft | 67 days | 97.2% |
| Jun 2026 | 120 | $379,450 | $215/sq ft | 83 days | 97.3% |
| Jul 2026 | 106 | $373,000 | $233/sq ft | 75 days | 97.5% |
| Aug 2026 | 90 | $337,000 | $213/sq ft | 68 days | 98.4% |
| Sep 2026 | 100 | $357,000 | $223/sq ft | 82 days | 97.4% |
| Oct 2026 | 95 | $359,000 | $218/sq ft | 68 days | 97.5% |
| Nov 2026 (to date) | 10 | $337,500 | $206/sq ft | 96 days | 95.2% |
Indian River County Inventory Over Time
Active listings, new listings and homes under contract in Indian River County, from BreakThru Realty's daily snapshots of BeachesMLS (recorded since 2026-09-16).
| Date | Active listings | New this week | Under contract | Sold in 30 days | Median list (single-family) | Median list (condos) |
|---|---|---|---|---|---|---|
| 2026-10-06 | 541 | 54 | 164 | 85 | $439,900 | $229,000 |
| 2026-10-07 | 543 | 55 | 166 | 88 | $439,950 | $229,000 |
| 2026-10-08 | 539 | 56 | 166 | 94 | $448,000 | $234,000 |
| 2026-10-09 | 540 | 51 | 168 | 91 | $445,400 | $234,000 |
| 2026-10-10 | 536 | 43 | 168 | 92 | $439,999 | $229,000 |
| 2026-10-11 | 537 | 42 | 168 | 83 | $439,900 | $224,500 |
| 2026-10-12 | 536 | 42 | 173 | 82 | $439,900 | $228,900 |
| 2026-10-13 | 540 | 47 | 172 | 82 | $439,450 | $229,000 |
| 2026-10-15 | 532 | 39 | 166 | 80 | $439,450 | $242,000 |
| 2026-10-16 | 549 | 48 | 166 | 75 | $439,900 | $237,950 |
| 2026-10-17 | 555 | 52 | 161 | 78 | $439,900 | $240,950 |
| 2026-10-18 | 555 | 55 | 161 | 73 | $439,950 | $240,950 |
| 2026-10-19 | 559 | 58 | 159 | 68 | $439,900 | $239,900 |
| 2026-10-20 | 559 | 60 | 157 | 73 | $439,950 | $237,950 |
| 2026-10-21 | 557 | 55 | 159 | 76 | $441,450 | $243,500 |
| 2026-10-22 | 553 | 52 | 162 | 76 | $440,900 | $245,000 |
| 2026-10-23 | 552 | 47 | 162 | 77 | $440,900 | $245,000 |
| 2026-10-24 | 557 | 44 | 159 | 76 | $439,900 | $244,000 |
| 2026-10-25 | 553 | 40 | 163 | 74 | $439,900 | $245,450 |
| 2026-10-26 | 561 | 44 | 161 | 73 | $439,999 | $245,450 |
| 2026-10-28 | 560 | 33 | 164 | 74 | $442,900 | $243,000 |
| 2026-10-29 | 568 | 36 | 160 | 75 | $441,900 | $242,500 |
| 2026-10-30 | 566 | 41 | 160 | 76 | $443,900 | $242,000 |
| 2026-10-31 | 566 | 43 | 155 | 84 | $448,000 | $235,000 |
| 2026-11-01 | 563 | 48 | 152 | 78 | $448,000 | $236,000 |
| 2026-11-02 | 558 | 46 | 154 | 75 | $448,000 | $236,000 |
| 2026-11-03 | 563 | 45 | 150 | 81 | $441,900 | $242,000 |
| 2026-11-04 | 567 | 46 | 148 | 82 | $447,950 | $242,000 |
| 2026-11-05 | 573 | 47 | 148 | 82 | $448,000 | $245,000 |
| 2026-11-06 | 571 | 39 | 147 | 80 | $448,000 | $245,000 |
Home Prices in Indian River County
Over the last 90 days the median single-family home in Indian River County sold for $370,750 ($227 per square foot) and the median condo or townhome for $187,500 ($151 per square foot). Against the same 90 days a year earlier that is -1.1% for single-family homes and +4.2% for condos. Homes on the market now are asking a median $448,500 (single-family) and $245,000 (condos and townhomes). Medians describe the middle of the market; a waterfront estate and a garden condo pull in opposite directions, which is why the two segments are reported separately.
Inventory and the Pace of Sales
574 homes and condos are for sale in Indian River County today, 40 of them listed in the last seven days, and 144 are under contract. 84 sales closed in the last 30 days. Single-family homes carry 5.5 months of inventory and condos 8.8 months, which makes the single-family side a balanced market: under four months favours sellers, over six favours buyers. Active single-family listings have been on the market 103 days on average, condos 85 days.
Single-Family Homes vs. Condos and Townhomes
The two halves of the Indian River County market move differently. Single-family sellers achieved 97.9% of their asking price on the typical sale in the last 90 days after 74 days on market; condo and townhome sellers achieved 95.8% after 72 days. 222 single-family homes and 48 condos and townhomes closed in that window. Condo pricing also carries the building's fees, reserves and rental rules, so a low list price in an older tower is not the same deal as a low list price on a lot.
The Last Twelve Months
1,184 residential sales closed in Indian River County over the last twelve months. The whole-market median sold price moved from $363,500 in Dec 2025 to $359,000 in Oct 2026, a change of -1.2%. The month-by-month table below shows closings, median price, price per square foot and days to sell; the current month is partial until it closes.
What These Figures Mean If You Are Selling in Indian River County
The figures above describe all of Indian River County. Your price comes from the closed sales that match your home: the same neighborhood, the same water or golf course position, the same age and condition. The sale to list ratio shows how far buyers are negotiating below asking, days on market shows how long a well priced home waits, and months of inventory shows whether buyers or sellers hold the leverage this season. Request the review below and a broker applies all three to your address before you decide on a price.
Investing in Indian River County
Investors buy in Indian River for seasonal rental demand on the island and in the club communities, for annual rental demand from Vero Beach's hospital and employers, and for entry prices in Sebastian and Fellsmere. Rental rules in the club communities are restrictive, so we confirm them before you buy; the price-reduced and waterfront pages track where the value is, and the rentals page carries live rentals and a landlord page.
Follow the Indian River County Market as It Moves
Leave your email on this page and BreakThru Realty sends you each new Indian River County listing and price drop the day it reaches the MLS, with no account needed. Owners can request a review of what their own home is worth against these figures; buyers can ask for a showing or a search.
Thinking About Selling in Indian River County?
The median Indian River County single family home closed at $370,750 in the last 90 days and took 74 days to go under contract. Prices in your neighborhood may differ from the county average. Your buyer may already be looking. BreakThru Realty works with hundreds of prequalified buyers searching for properties. Enter your address and a licensed broker prepares your selling options from the closed sales nearest your home and checks it against the buyers on file.
- A value range built from comparable Indian River County sales, with the reasoning
- Whether a buyer already working with BreakThru Realty is looking for a property like yours
- The plan that reaches the rest of the market if no buyer on file fits
- An estimate of your selling costs and what you would keep after closing
- Your timing, privacy and goals, worked through before anything is listed
Selling in Indian River County?
See what your home is worth from recent Indian River County sales, the days on market and today's buyer demand. See what my home would sell for.
Buying in Indian River County?
Every home, condo and townhome for sale in Indian River County, straight from the MLS and updated through the day. Find my Indian River County home.
Investing in Indian River County?
Multifamily, rental and value add property in Indian River County, with the taxes, association fees and price history on every listing. Evaluate Indian River County investments.
Indian River County Housing Market FAQ
- What is the median home price in Indian River County?
- Over the last 90 days the median sold price in Indian River County was $370,750 for single-family homes and $187,500 for condos and townhomes, from BeachesMLS closings as of November 7, 2026. Homes for sale now are asking a median $448,500 and $245,000 respectively. These figures refresh daily on this page.
- Is Indian River County a buyer's market or a seller's market?
- By months of inventory, the single-family side of Indian River County is a balanced market right now: 5.5 months of supply, with condos and townhomes at 8.8 months (buyer's market). Under four months of supply favours sellers, over six favours buyers, and the two segments often sit on different sides of that line in South Florida.
- How long does it take to sell a home in Indian River County?
- Single-family homes that closed in Indian River County in the last 90 days had been on the market 74 days on average, and condos and townhomes 72 days. Sellers achieved 97.9% of their asking price on the typical single-family sale and 95.8% on the typical condo sale. Well-priced homes go under contract in the first few weeks; the average is pulled up by listings that started too high.
- Are home prices in Indian River County going up or down?
- Over the last twelve months the whole-market median sold price in Indian River County moved from $363,500 (Dec 2025) to $359,000 (Oct 2026), -1.2%. Comparing the last 90 days with the same 90 days a year earlier, single-family medians are -1.1% and condo medians +4.2%. Monthly medians swing with the mix of homes that happened to close, so the direction over several months matters more than any one month.
- Are condo prices in Indian River County going up or down?
- The median condo or townhome in Indian River County closed at $187,500 in the last 90 days, up 4.2% against the same 90 days a year earlier, with 8.8 months of condo inventory on the market and 72 days on average to go under contract, from BeachesMLS closings as of November 7, 2026. A citywide condo median blends every building and line; what a particular condo is worth comes from the closings in its own building, its association fees and its reserve and inspection status.
- Where do these numbers come from?
- Every figure is computed from BeachesMLS: active listings are counted as of the refresh date (November 7, 2026), sold figures cover closings in the last 90 days compared with the same 90 days a year earlier, and the monthly table buckets closed sales by closing date. Statistics refresh once a day and are cached; inventory over time comes from our own daily snapshots. Nothing on this page is typed by hand, and none of it is an appraisal. BreakThru Realty's market data methodology page explains every calculation, and broker of record Tyson E. Sam reviews the method and the written guidance in this report.