BreakThru Realty Greenacres Housing Market Report
In the 90 days to October 30, 2026, the median single-family home in Greenacres sold for $454,500 and the median condo or townhome for $190,000; 338 homes and condos are for sale. By months of inventory, single-family homes are a balanced market and condos and townhomes a buyer's market. BreakThru Realty analyzes BeachesMLS data daily to track home prices, inventory, sales, days on market and market direction in Greenacres, Florida; nothing here is typed by hand.
Greenacres Housing Market: Key Figures
- The median single-family home in Greenacres sold for $454,500 over the last 90 days, -4.1% against the same period a year earlier.
- The median condo or townhome sold for $190,000, -13.6% year over year.
- Single-family homes that sold averaged 53 days on the market; condos and townhomes 74 days.
- With 5.2 months of inventory, single-family homes are a balanced market; condos and townhomes, at 8 months, are a buyer's market.
- 338 homes and condos were for sale in Greenacres on October 30, 2026.
Greenacres Market at a Glance
Updated October 30, 2026 from BeachesMLS.
- 338homes & condos for sale
- 15new listings this week
- 71under contract
- 118waterfront listings
- 5luxury listings ($1,000,000+)
- 49sold in the last 30 days
Newest Greenacres Homes for Sale
The 30 newest homes, condos and townhomes on the market in Greenacres, straight from BeachesMLS. The 30 listings on this page run from $55,000 to $792,290, with a median of $492,345, about $267 per square foot, and they have been listed a median of 20 days.
- The communities with the most listings here are Blossom Trail (3), Greenacres 2 (2), Olive Tree Par 5d (2), Olive Tree Par 6a (2) and River Bridge 2 (2), 11 of the 30; the others are spread across 19 more communities.
- By type: 23 single-family homes, 4 townhomes and villas and 1 multifamily property.
- Bedrooms run from 2 to 6, a median of 3; they were built between 1977 and 2026, a median of 2001, and 6 in the last ten years.
- 4 of the 30 have a pool, and 10 are on the water.
- They sit in 4 ZIP codes: 33413, 33415, 33463 and 33467.
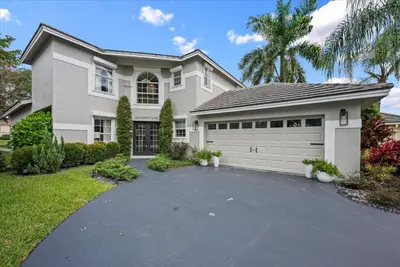 $599,000
149 HARBOR LAKE Circle, Greenacres FL 33413
3 bd · 3 ba · 2,238 sq ft · Single Family Residence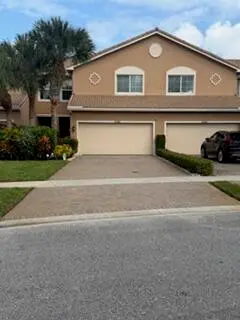 $434,900
4385 Colony View Drive, Greenacres FL 33463
3 bd · 3 ba · 1,851 sq ft · Townhouse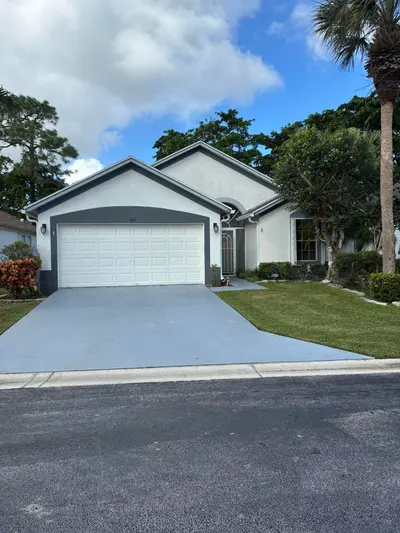 $395,000
412 TROTTERS Lane, Greenacres FL 33413
3 bd · 2 ba · 1,221 sq ft · Single Family Residence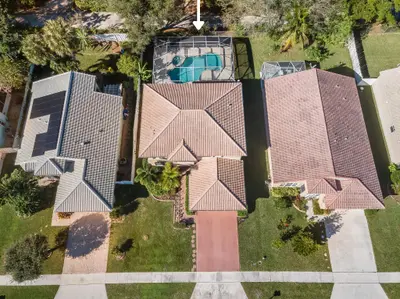 $619,000
6570 Spring Meadow Drive, Greenacres FL 33413
5 bd · 3 ba · 2,372 sq ft · Single Family Residence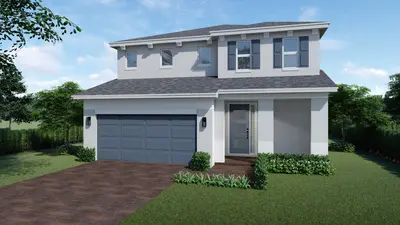 $787,990
5058 Petunia Way, Greenacres FL 33463
5 bd · 4 ba · 3,072 sq ft · Single Family Residence$450,000
112 Caribe Court, Greenacres FL 33413
3 bd · 2 ba · 1,506 sq ft · Single Family Residence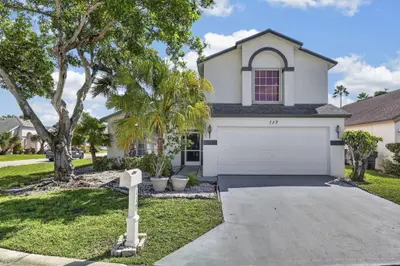 $399,000
117 HAMMOCKS Court, Greenacres FL 33413
4 bd · 3 ba · 2,054 sq ft · Single Family Residence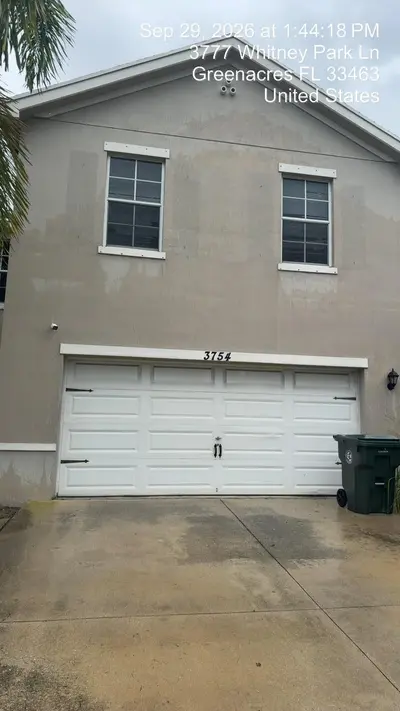 $465,000
3754 WHITNEY PARK Lane, Greenacres FL 33463
4 bd · 3 ba · 2,078 sq ft · Single Family Residence$458,146
1724 Sawgrass Circle, Greenacres FL 33413
3 bd · 2 ba · 1,742 sq ft · Single Family Residence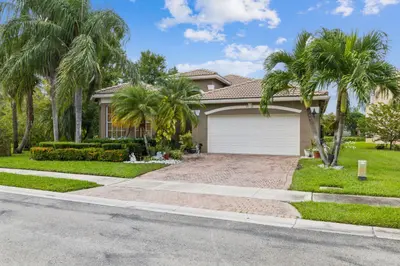 $629,900
5521 ALBIN Drive, Greenacres FL 33463
4 bd · 3 ba · 2,489 sq ft · Single Family Residence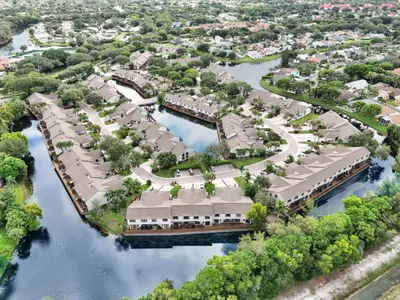 $400,000
1703 LANDINGS Boulevard, Greenacres FL 33413
4 bd · 3 ba · 1,798 sq ft · Townhouse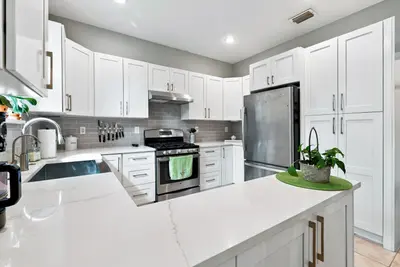 $475,000
1034 Cape Cod Terrace, Greenacres FL 33413
3 bd · 2 ba · 1,444 sq ft · Single Family Residence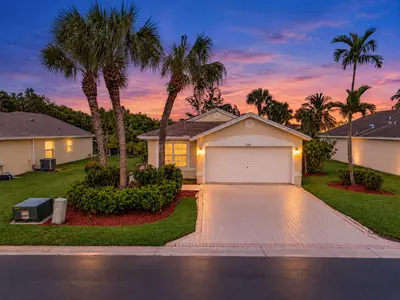 $470,000
1788 SAWGRASS Circle, Greenacres FL 33413
3 bd · 2 ba · 1,367 sq ft · Single Family Residence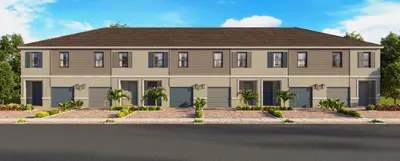 $509,690
6002 Begonia Circle, Greenacres FL 33463
3 bd · 3 ba · 1,472 sq ft · Townhouse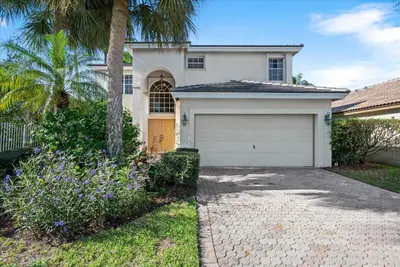 $680,000
7639 Northtree Club Drive, Greenacres FL 33467
4 bd · 3 ba · 2,561 sq ft · Single Family Residence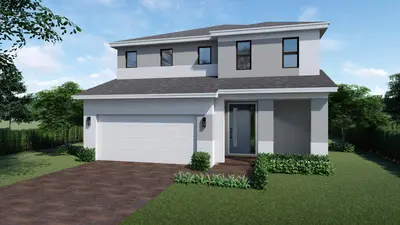 $792,290
5161 Begonia Circle, Greenacres FL 33463
5 bd · 4 ba · 3,072 sq ft · Single Family Residence$590,000
4707 Foxtail Palm Court, Greenacres FL 33463
4 bd · 3 ba · 2,365 sq ft · Single Family Residence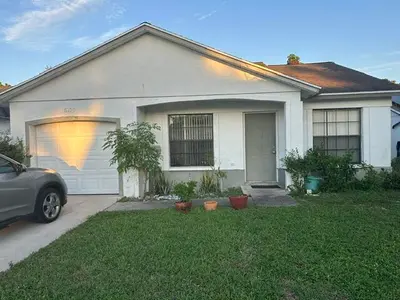 $399,900
5121 Arbor Glen Circle, Greenacres FL 33463
3 bd · 2 ba · 1,139 sq ft · Single Family Residence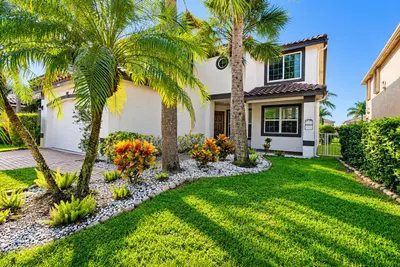 $724,900
5018 Nautica Lake Circle, Greenacres FL 33463
6 bd · 4 ba · 3,338 sq ft · Single Family Residence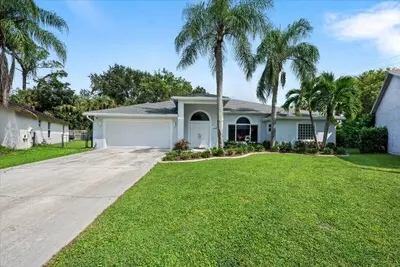 $659,000
264 MALIBU Circle, Greenacres FL 33413
4 bd · 2 ba · 2,190 sq ft · Single Family Residence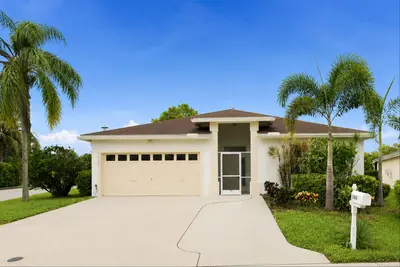 $425,000
1490 Fairway Circle, Greenacres FL 33413
2 bd · 2 ba · 1,340 sq ft · Single Family Residence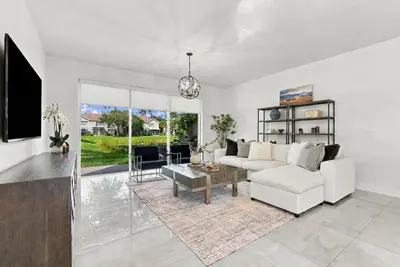 $425,000
1086 WOODFIELD Road, Greenacres FL 33415
3 bd · 3 ba · 1,504 sq ft · Townhouse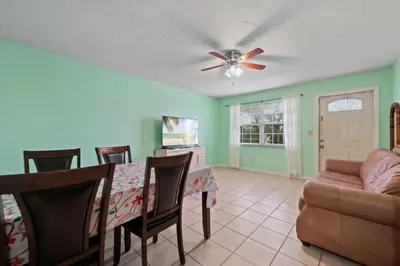 $550,000
149 Broward Avenue, Greenacres FL 33463
0 ba · 1,925 sq ft · Duplex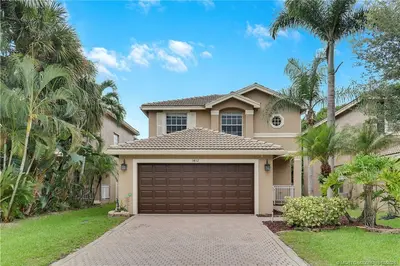 $459,000
5432 Sealine Boulevard, Greenacres FL 33463
3 bd · 3 ba · 1,616 sq ft · Single Family Residence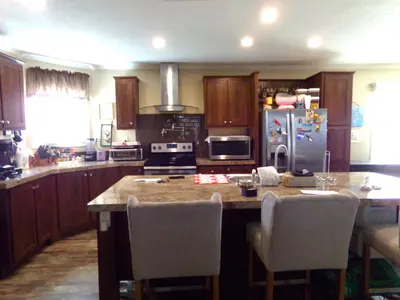 $145,000
147 Plantation Boulevard, Greenacres FL 33467
3 bd · 2 ba · 1,495 sq ft · Manufactured Home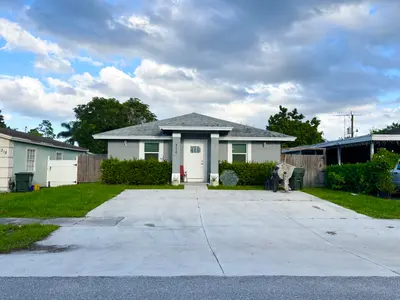 $550,000
310 JENNINGS Avenue, Greenacres FL 33463
3 bd · 2 ba · 1,529 sq ft · Single Family Residence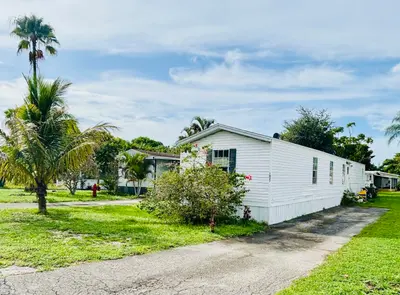 $55,000
1027 Marco Court, Greenacres FL 33463
3 bd · 2 ba · 1,120 sq ft · Mobile Home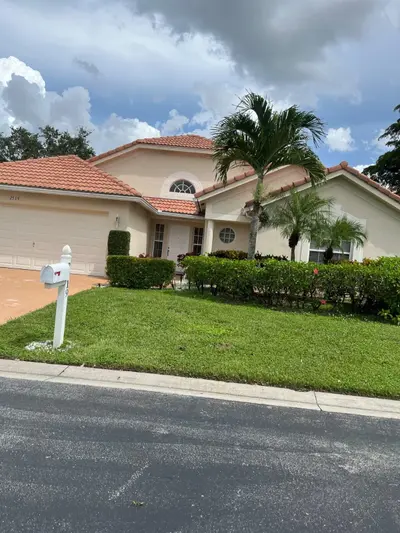 $569,999
2519 EGRET LAKE Drive, Greenacres FL 33413
3 bd · 2 ba · 1,903 sq ft · Single Family Residence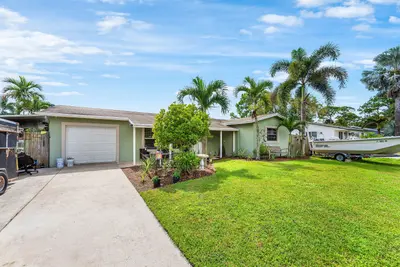 $565,000
7416 Cocoanut Drive, Greenacres FL 33467
3 bd · 2 ba · 1,370 sq ft · Single Family Residence$515,000
5402 W Queenship Court, Greenacres FL 33463
4 bd · 3 ba · 2,077 sq ft · Single Family Residence
| Single-family homes | Condos & townhomes | |
|---|---|---|
| Active listings | 66 | 252 |
| Median list price | $526,500 | $209,950 |
| Median list price per sq ft | $268/sq ft | $194/sq ft |
| Average days on market | 78 days | 106 days |
| Sold in the last 90 days | 38 | 94 |
| Median sold price (90 days) | $454,500 | $190,000 |
| Sale price as % of list price | 96.7% | 97.6% |
| Months of inventory | 5.2 months | 8 months |
| Median sold price vs. a year ago | -4.1% | -13.6% |
Source: BeachesMLS. Active listings as of October 30, 2026; sold figures cover closings in the last 90 days, compared with the same 90 days one year earlier. Not an appraisal. How these figures are calculated.
Greenacres Home Sales by Month
Closed residential sales in Greenacres by closing month, from BeachesMLS. The current month is partial until it closes.
| Month | Closed sales | Median sold price | Median $/sq ft | Avg days to sell | Sale-to-list |
|---|---|---|---|---|---|
| Nov 2025 | 33 | $250,000 | $210/sq ft | 115 days | 96.6% |
| Dec 2025 | 50 | $288,813 | $217/sq ft | 76 days | 96.8% |
| Jan 2026 | 36 | $291,000 | $199/sq ft | 79 days | 96.9% |
| Feb 2026 | 39 | $285,000 | $212/sq ft | 64 days | 98% |
| Mar 2026 | 40 | $257,500 | $196/sq ft | 81 days | 97.1% |
| Apr 2026 | 59 | $289,000 | $219/sq ft | 99 days | 96.8% |
| May 2026 | 64 | $341,500 | $227/sq ft | 72 days | 98.4% |
| Jun 2026 | 61 | $286,000 | $204/sq ft | 61 days | 98.5% |
| Jul 2026 | 58 | $276,500 | $206/sq ft | 69 days | 96.6% |
| Aug 2026 | 49 | $260,000 | $209/sq ft | 74 days | 97.3% |
| Sep 2026 | 47 | $300,000 | $215/sq ft | 54 days | 96.5% |
| Oct 2026 (to date) | 43 | $256,000 | $192/sq ft | 79 days | 98% |
Greenacres Inventory Over Time
Active listings, new listings and homes under contract in Greenacres, from BreakThru Realty's daily snapshots of BeachesMLS (recorded since 2026-10-29).
| Date | Active listings | New this week | Under contract | Sold in 30 days | Median list (single-family) | Median list (condos) |
|---|---|---|---|---|---|---|
| 2026-10-29 | 335 | 15 | 69 | 48 | $528,000 | $210,000 |
| 2026-10-30 | 338 | 15 | 71 | 49 | $526,500 | $209,950 |
Greenacres Rental Market at a Glance
Updated October 30, 2026 from BeachesMLS.
- 105homes for rent
- $2,150/momedian asking rent
- 12new rentals this week
- 44leased in the last 30 days
| Houses & townhomes | Condos & apartments | |
|---|---|---|
| Active rentals | 45 | 60 |
| Median asking rent | $2,500/mo | $1,900/mo |
| Median rent per sq ft | $1.86/sq ft | $1.93/sq ft |
| Average days on market | 54 days | 70 days |
| Leased in the last 90 days | 53 | 69 |
| Median leased rent (90 days) | $2,600/mo | $1,850/mo |
| Median leased rent vs. a year ago | +4% | +8.8% |
Source: BeachesMLS. Asking rents are active rentals as of October 30, 2026; leased rents cover leases signed in the last 90 days, compared with the same 90 days one year earlier. Not an appraisal.
Home Prices in Greenacres
Over the last 90 days the median single-family home in Greenacres sold for $454,500 ($255 per square foot) and the median condo or townhome for $190,000 ($181 per square foot). Against the same 90 days a year earlier that is -4.1% for single-family homes and -13.6% for condos. Homes on the market now are asking a median $526,500 (single-family) and $209,950 (condos and townhomes). Medians describe the middle of the market; a waterfront estate and a garden condo pull in opposite directions, which is why the two segments are reported separately.
Inventory and the Pace of Sales
338 homes and condos are for sale in Greenacres today, 15 of them listed in the last seven days, and 71 are under contract. 49 sales closed in the last 30 days. Single-family homes carry 5.2 months of inventory and condos 8 months, which makes the single-family side a balanced market: under four months favours sellers, over six favours buyers. Active single-family listings have been on the market 78 days on average, condos 106 days.
Single-Family Homes vs. Condos and Townhomes
The two halves of the Greenacres market move differently. Single-family sellers achieved 96.7% of their asking price on the typical sale in the last 90 days after 53 days on market; condo and townhome sellers achieved 97.6% after 74 days. 38 single-family homes and 94 condos and townhomes closed in that window. Condo pricing also carries the building's fees, reserves and rental rules, so a low list price in an older tower is not the same deal as a low list price on a lot.
The Last Twelve Months
579 residential sales closed in Greenacres over the last twelve months. The whole-market median sold price moved from $250,000 in Nov 2025 to $300,000 in Sep 2026, a change of +20%. The month-by-month table below shows closings, median price, price per square foot and days to sell; the current month is partial until it closes.
Selling a Home in Greenacres
BreakThru Realty works with hundreds of prequalified buyers searching for properties. Before your Greenacres home is listed, a broker checks it against the requirements those buyers have given us, whether that is a lake lot behind a gate, a townhome near Jog Road or a duplex on the old plat, and reaches out to the buyers it fits; your home may be the one a buyer is waiting to find. If no buyer on file fits, the MLS listing takes the home to cooperating agents across the county, priced from the closed sales that match it. Throughout, the strategy follows your objectives: your timing, the price you need and the move you are making next. Pricing here turns on the community and the condition. A house in River Bridge or Nautica Isles is compared with sales inside the same gates and, on the water, with other lake lots; a resale near Blossom Trail competes with the builder's new homes and incentives; and a house with a new roof and impact windows sells apart from one with the originals. Request Your Property Valuation for a first number from matched closed sales, ask for a full comparative market analysis when you are ready to list, or request a cash offer if a fast, as is sale suits you better.
Investing in Greenacres
Investors in Greenacres buy for steady annual rents more than for seasonal ones. The core strategy is a house or townhome in a gated community leased by the year to a family, where the association's leasing rules, its approval process and any waiting period after purchase come first, and the rent is set from the leases that closed in the same community. The second is small multifamily on the old plat, duplexes and groups of rental cottages around Fleming Avenue and Broward Avenue, where the permits for every unit and the condition of older buildings decide the return. The third is land: parcels along Jog Road and Haverhill Road and acreage on Dillman Road and De Soto Road bought for what the zoning allows, which the city or the county confirms depending on the jurisdiction. Manufactured homes cost little to buy but carry a monthly lot or association charge that leaves thin margins. Get Your Investment Property Analysis: we model the rent from current Greenacres leases and the resale from matched closed sales before you offer.
Follow the Greenacres Market as It Moves
Leave your email on this page and BreakThru Realty sends you each new Greenacres listing and price drop the day it reaches the MLS, with no account needed. Owners can request a review of what their own home is worth against these figures; buyers can ask for a showing or a search.
Thinking About Selling in Greenacres?
The median Greenacres single family home closed at $454,500 in the last 90 days and took 53 days to go under contract. Prices in your neighborhood may differ from the city average. Your buyer may already be looking: breakThru Realty works with hundreds of prequalified buyers searching for properties. Enter your address and a licensed broker prepares your selling options from the closed sales nearest your home and checks it against the buyers on file.
- A value range built from comparable Greenacres sales, with the reasoning
- Whether a buyer already working with BreakThru Realty is looking for a property like yours
- The plan that reaches the rest of the market if no buyer on file fits
- An estimate of your selling costs and what you would keep after closing
- Your timing, privacy and goals, worked through before anything is listed
Selling in Greenacres?
See what your home is worth from recent Greenacres sales, the days on market and today's buyer demand. See what my home would sell for.
Buying in Greenacres?
Every home, condo and townhome for sale in Greenacres, straight from the MLS and updated through the day. Find my Greenacres home.
Investing in Greenacres?
Multifamily, rental and value add property in Greenacres, with the taxes, association fees and price history on every listing. Evaluate Greenacres investments.
Greenacres Housing Market FAQ
- What is the median home price in Greenacres?
- Over the last 90 days the median sold price in Greenacres was $454,500 for single-family homes and $190,000 for condos and townhomes, from BeachesMLS closings as of October 30, 2026. Homes for sale now are asking a median $526,500 and $209,950 respectively. These figures refresh daily on this page.
- Is Greenacres a buyer's market or a seller's market?
- By months of inventory, the single-family side of Greenacres is a balanced market right now: 5.2 months of supply, with condos and townhomes at 8 months (buyer's market). Under four months of supply favours sellers, over six favours buyers, and the two segments often sit on different sides of that line in South Florida.
- How long does it take to sell a home in Greenacres?
- Single-family homes that closed in Greenacres in the last 90 days had been on the market 53 days on average, and condos and townhomes 74 days. Sellers achieved 96.7% of their asking price on the typical single-family sale and 97.6% on the typical condo sale. Well-priced homes go under contract in the first few weeks; the average is pulled up by listings that started too high.
- Are home prices in Greenacres going up or down?
- Over the last twelve months the whole-market median sold price in Greenacres moved from $250,000 (Nov 2025) to $300,000 (Sep 2026), +20%. Comparing the last 90 days with the same 90 days a year earlier, single-family medians are -4.1% and condo medians -13.6%. Monthly medians swing with the mix of homes that happened to close, so the direction over several months matters more than any one month.
- What is the median rent in Greenacres?
- The median asking rent in Greenacres is $2,150 a month across 105 active rentals: $2,500 for houses and townhomes and $1,900 for condos and apartments. The Greenacres rentals hub carries the full rental market table, updated daily.
- Where do these numbers come from?
- Every figure is computed from BeachesMLS: active listings are counted as of the refresh date (October 30, 2026), sold figures cover closings in the last 90 days compared with the same 90 days a year earlier, and the monthly table buckets closed sales by closing date. Statistics refresh once a day and are cached; inventory over time comes from our own daily snapshots. Nothing on this page is typed by hand, and none of it is an appraisal. BreakThru Realty's market data methodology page explains every calculation, and broker of record Tyson E. Sam reviews the method and the written guidance in this report.
Explore
- Greenacres real estate & homes for sale
- Sell your Greenacres home
- Recently sold homes in Greenacres
- What is my Greenacres home worth?
- Guaranteed cash offer
- Greenacres rentals & rent prices
- Palm Beach County housing market
- BreakThru Realty Research: every South Florida market report
- How these market figures are calculated