BreakThru Realty Boynton Beach Housing Market Report
In the 90 days to November 8, 2026, the median single-family home in Boynton Beach sold for $535,000 and the median condo or townhome for $226,500; 1,281 homes and condos are for sale. By months of inventory, single-family homes are a seller's market and condos and townhomes a buyer's market. BreakThru Realty analyzes BeachesMLS data daily to track home prices, inventory, sales, days on market and market direction in Boynton Beach, Florida; nothing here is typed by hand.
Boynton Beach Housing Market: Key Figures
- The median single-family home in Boynton Beach sold for $535,000 over the last 90 days, +5.3% against the same period a year earlier.
- The median condo or townhome sold for $226,500, -10.1% year over year.
- Single-family homes that sold averaged 58 days on the market; condos and townhomes 85 days.
- With 3.5 months of inventory, single-family homes are a seller's market; condos and townhomes, at 6.9 months, are a buyer's market.
- 1,281 homes and condos were for sale in Boynton Beach on November 8, 2026.
Boynton Beach Market at a Glance
Updated November 8, 2026 from BeachesMLS.
- 1,281homes & condos for sale
- 118new listings this week
- 342under contract
- 457waterfront listings
- 97luxury listings ($1,000,000+)
- 221sold in the last 30 days
Newest Boynton Beach Homes for Sale
The 30 newest homes, condos and townhomes on the market in Boynton Beach, straight from BeachesMLS. The 30 listings on this page run from $129,000 to $1,255,000, with a median of $525,000, about $279 per square foot, and they have been listed a median of 2 days.
- The communities with the most listings here are Jamaica Bay Mobile Home Co Op (2) and Windchime Lakes (2), 4 of the 30; the others are spread across 26 more communities.
- By type: 23 single-family homes, 3 townhomes and villas and 1 condo.
- Bedrooms run from 2 to 5, a median of 3; they were built between 1956 and 2020, a median of 1991, and 1 in the last ten years.
- 3 of the 30 have a pool, and 11 are on the water.
- They sit in 6 ZIP codes: 33426, 33435, 33436, 33437, 33472 and 33473.
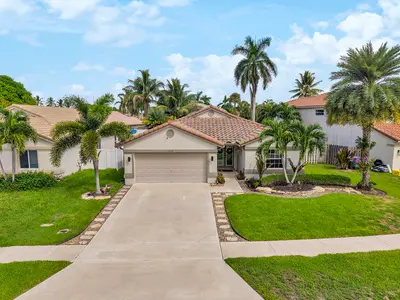 $579,000
6243 Windlass Circle, Boynton Beach FL 33472
3 bd · 2 ba · 1,809 sq ft · Single Family Residence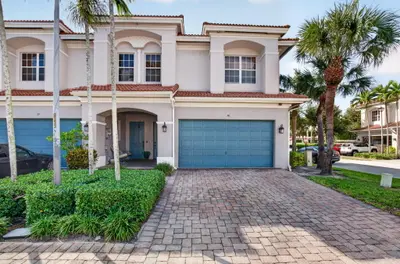 $499,999
78 Landau Street, Boynton Beach FL 33426
3 bd · 2.5 ba · 2,209 sq ft · Townhouse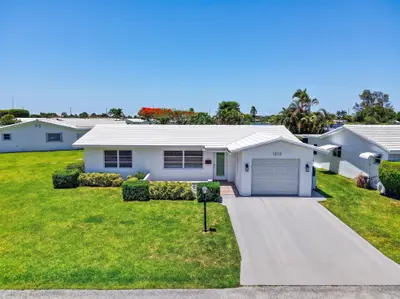 $524,999
1213 SW 20th Avenue, Boynton Beach FL 33426
3 bd · 2 ba · 1,812 sq ft · Single Family Residence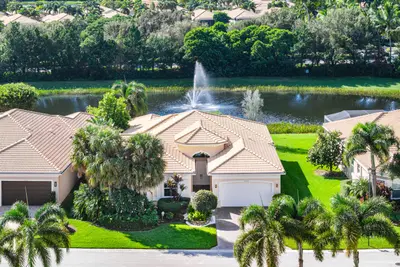 $1,255,000
12018 Bear River Road, Boynton Beach FL 33473
4 bd · 3 ba · 2,770 sq ft · Single Family Residence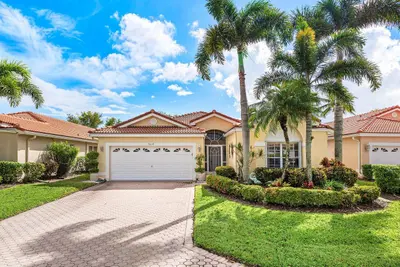 $499,999
9639 ORCHID GROVE Trail, Boynton Beach FL 33437
3 bd · 2 ba · 2,144 sq ft · Single Family Residence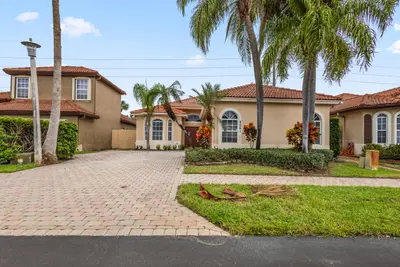 $545,000
8061 Saw Palmetto Lane, Boynton Beach FL 33436
3 bd · 2 ba · 2,922 sq ft · Single Family Residence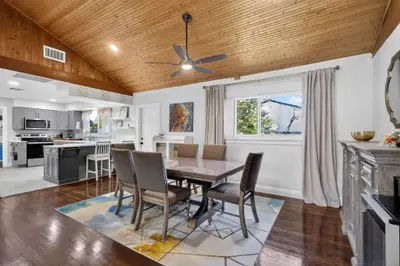 $550,000
201 SE 24TH Avenue, Boynton Beach FL 33435
2 bd · 2 ba · 1,196 sq ft · Single Family Residence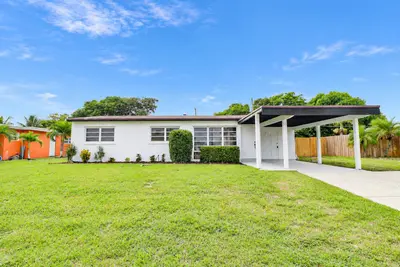 $435,000
1615 N Seacrest Boulevard, Boynton Beach FL 33435
4 bd · 2 ba · 1,663 sq ft · Single Family Residence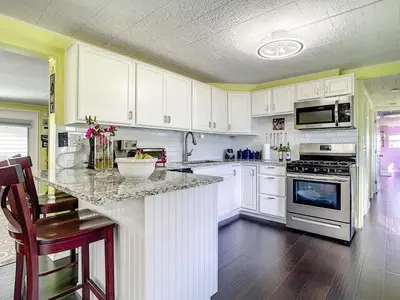 $223,900
4215 MEADOW VIEW Drive, Boynton Beach FL 33436
4 bd · 2.5 ba · 1,344 sq ft · Mobile Home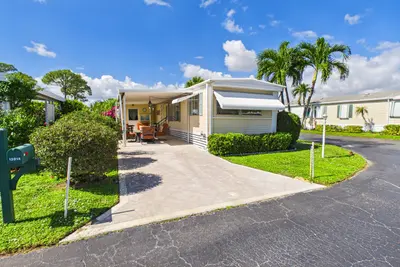 $129,000
12014 IGUANA BAY, Boynton Beach FL 33436
2 bd · 2 ba · 936 sq ft · Manufactured Home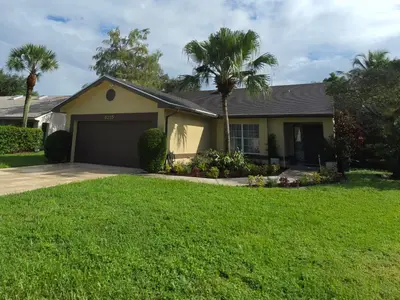 $499,900
4215 Green Forest Way, Boynton Beach FL 33436
3 bd · 2 ba · 1,470 sq ft · Single Family Residence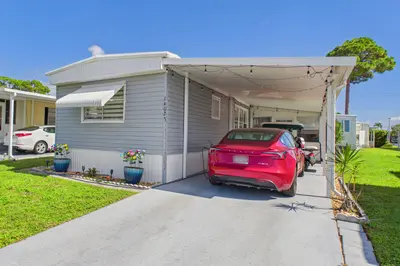 $137,000
14023 KINGSTON BAY, Boynton Beach FL 33436
2 bd · 2 ba · 1,059 sq ft · Manufactured Home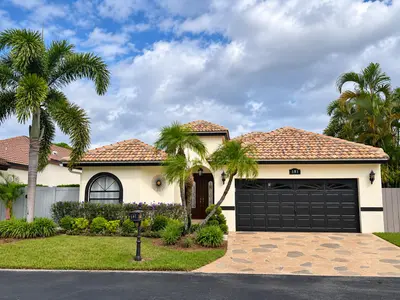 $675,000
181 EXECUTIVE Circle, Boynton Beach FL 33436
3 bd · 3 ba · 1,781 sq ft · Single Family Residence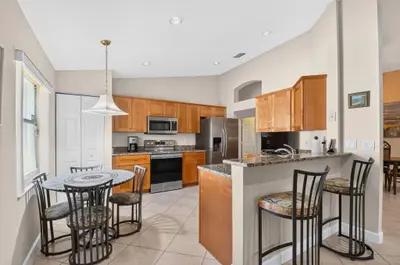 $449,000
9864 Arbor View Drive, Boynton Beach FL 33437
3 bd · 2 ba · 1,744 sq ft · Single Family Residence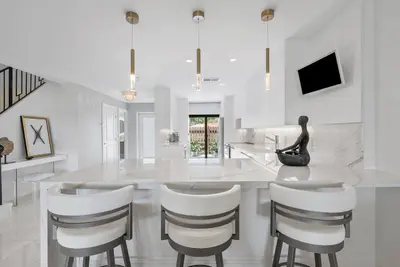 $429,900
19 SOUTHPORT Lane C, Boynton Beach FL 33436
2 bd · 2.5 ba · 1,692 sq ft · Townhouse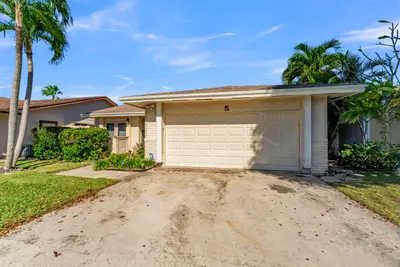 $449,000
5 Islington Place, Boynton Beach FL 33426
3 bd · 2 ba · 1,409 sq ft · Single Family Residence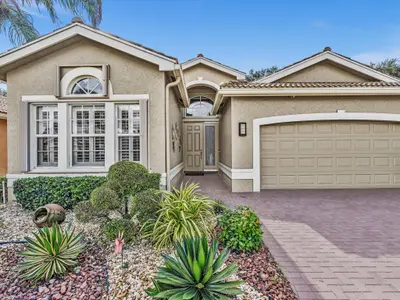 $550,000
7452 TWIN FALLS Drive, Boynton Beach FL 33437
3 bd · 2 ba · 2,141 sq ft · Single Family Residence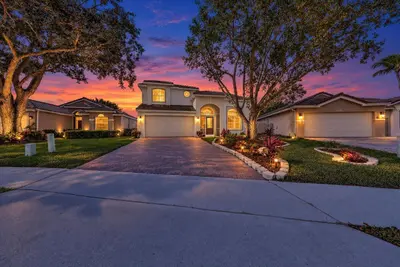 $749,000
12131 DUNHILL Drive, Boynton Beach FL 33437
3 bd · 2.5 ba · 2,011 sq ft · Single Family Residence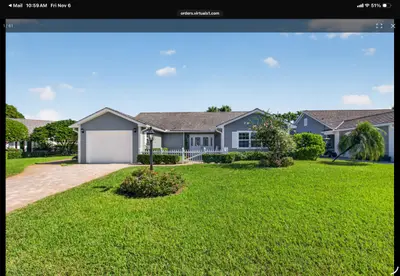 $965,000
13 Holly Drive, Boynton Beach FL 33436
3 bd · 2 ba · 2,248 sq ft · Villa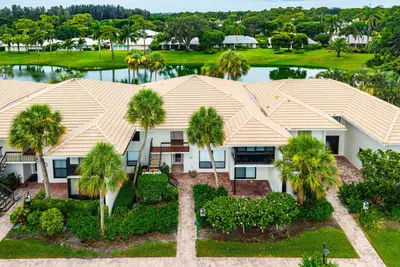 $525,000
3668 Quail Ridge Drive Green Heron S, Boynton Beach FL 33436
3 bd · 2 ba · 1,958 sq ft · Condominium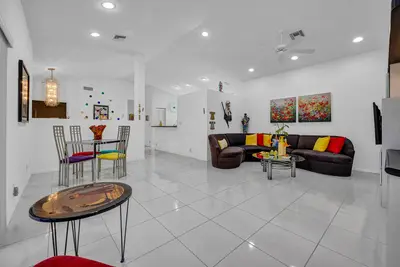 $399,000
12586 Coral Lakes Drive, Boynton Beach FL 33437
2 bd · 2 ba · 1,833 sq ft · Single Family Residence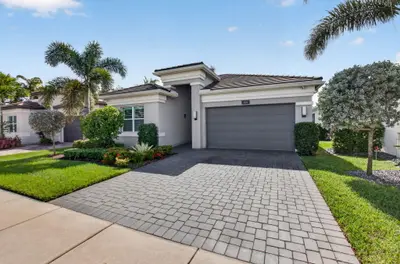 $989,000
9284 SILVER SHORES Lane, Boynton Beach FL 33473
2 bd · 2 ba · 1,783 sq ft · Single Family Residence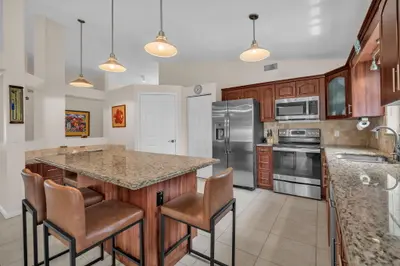 $600,000
8576 WINDY Circle, Boynton Beach FL 33472
4 bd · 2 ba · 2,043 sq ft · Single Family Residence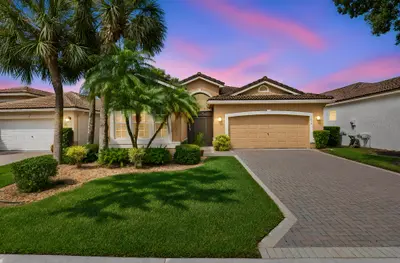 $675,000
7544 Citronella Street, Boynton Beach FL 33437
3 bd · 2 ba · 2,081 sq ft · Single Family Residence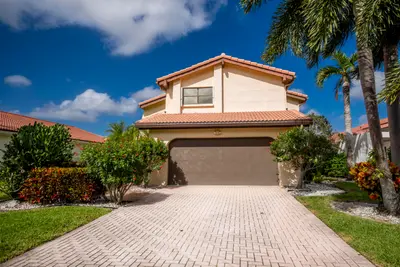 $565,000
5703 Lakeview Mews Drive, Boynton Beach FL 33437
4 bd · 2.5 ba · 2,533 sq ft · Single Family Residence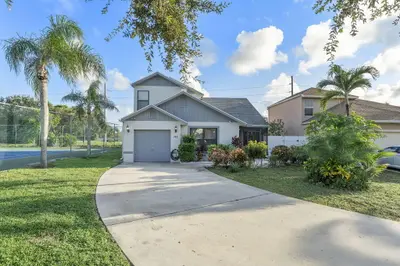 $470,000
143 TARA LAKES Drive, Boynton Beach FL 33436
3 bd · 2 ba · 1,567 sq ft · Single Family Residence $525,000
9671 HARBOUR LAKE Circle, Boynton Beach FL 33437
3 bd · 2 ba · 2,187 sq ft · Single Family Residence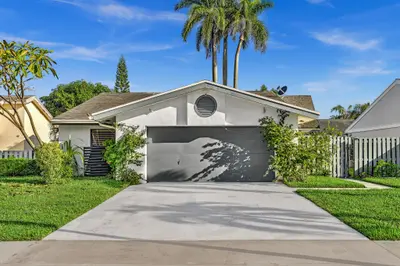 $495,000
82 BAYTREE Circle, Boynton Beach FL 33436
3 bd · 2 ba · 1,584 sq ft · Single Family Residence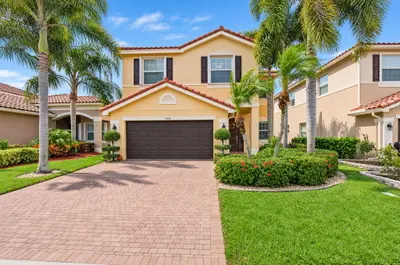 $975,000
8164 Ravenna Lakes Drive, Boynton Beach FL 33473
5 bd · 4 ba · 3,230 sq ft · Single Family Residence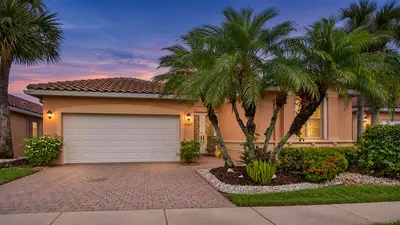 $508,000
7617 VINISTE Drive, Boynton Beach FL 33472
3 bd · 2 ba · 2,102 sq ft · Single Family Residence
| Single-family homes | Condos & townhomes | |
|---|---|---|
| Active listings | 488 | 608 |
| Median list price | $549,000 | $235,000 |
| Median list price per sq ft | $295/sq ft | $206/sq ft |
| Average days on market | 82 days | 121 days |
| Sold in the last 90 days | 420 | 264 |
| Median sold price (90 days) | $535,000 | $226,500 |
| Sale price as % of list price | 96.9% | 95.9% |
| Months of inventory | 3.5 months | 6.9 months |
| Median sold price vs. a year ago | +5.3% | -10.1% |
Source: BeachesMLS. Active listings as of November 8, 2026; sold figures cover closings in the last 90 days, compared with the same 90 days one year earlier. Not an appraisal. How these figures are calculated.
Boynton Beach Home Sales by Month
Closed residential sales in Boynton Beach by closing month, from BeachesMLS. The current month is partial until it closes.
| Month | Closed sales | Median sold price | Median $/sq ft | Avg days to sell | Sale-to-list |
|---|---|---|---|---|---|
| Dec 2025 | 283 | $401,800 | $241/sq ft | 79 days | 96.3% |
| Jan 2026 | 206 | $418,184 | $240/sq ft | 80 days | 96.3% |
| Feb 2026 | 253 | $360,000 | $223/sq ft | 87 days | 95.6% |
| Mar 2026 | 342 | $387,500 | $232/sq ft | 77 days | 96% |
| Apr 2026 | 324 | $397,000 | $235/sq ft | 73 days | 96.3% |
| May 2026 | 316 | $419,000 | $236/sq ft | 64 days | 96.6% |
| Jun 2026 | 350 | $397,500 | $241/sq ft | 72 days | 96.4% |
| Jul 2026 | 294 | $413,500 | $238/sq ft | 65 days | 97% |
| Aug 2026 | 288 | $415,000 | $250/sq ft | 75 days | 96.5% |
| Sep 2026 | 278 | $412,500 | $235/sq ft | 77 days | 96.5% |
| Oct 2026 | 250 | $374,000 | $231/sq ft | 67 days | 96.3% |
| Nov 2026 (to date) | 43 | $307,000 | $195/sq ft | 59 days | 95.7% |
Boynton Beach Inventory Over Time
Active listings, new listings and homes under contract in Boynton Beach, from BreakThru Realty's daily snapshots of BeachesMLS (recorded since 2026-09-16).
| Date | Active listings | New this week | Under contract | Sold in 30 days | Median list (single-family) | Median list (condos) |
|---|---|---|---|---|---|---|
| 2026-10-07 | 1,198 | 136 | 360 | 260 | $550,000 | $230,000 |
| 2026-10-08 | 1,196 | 130 | 363 | 268 | $554,900 | $234,950 |
| 2026-10-09 | 1,198 | 114 | 364 | 269 | $559,000 | $235,000 |
| 2026-10-10 | 1,201 | 117 | 367 | 267 | $550,000 | $235,000 |
| 2026-10-11 | 1,197 | 113 | 369 | 259 | $550,000 | $235,000 |
| 2026-10-13 | 1,210 | 115 | 368 | 254 | $550,000 | $235,000 |
| 2026-10-14 | 1,206 | 107 | 372 | 261 | $550,000 | $235,000 |
| 2026-10-15 | 1,179 | 87 | 375 | 257 | $550,000 | $235,000 |
| 2026-10-16 | 1,213 | 102 | 373 | 255 | $550,000 | $239,000 |
| 2026-10-17 | 1,221 | 107 | 365 | 254 | $550,000 | $235,000 |
| 2026-10-18 | 1,225 | 107 | 367 | 249 | $549,950 | $235,000 |
| 2026-10-19 | 1,229 | 108 | 364 | 241 | $550,000 | $235,000 |
| 2026-10-20 | 1,231 | 98 | 362 | 251 | $550,000 | $235,000 |
| 2026-10-21 | 1,233 | 107 | 363 | 261 | $549,950 | $235,000 |
| 2026-10-22 | 1,240 | 117 | 365 | 264 | $550,000 | $235,000 |
| 2026-10-23 | 1,245 | 114 | 362 | 264 | $550,000 | $235,000 |
| 2026-10-24 | 1,252 | 114 | 363 | 253 | $550,000 | $235,000 |
| 2026-10-25 | 1,256 | 117 | 364 | 241 | $550,000 | $235,000 |
| 2026-10-26 | 1,262 | 128 | 366 | 229 | $549,900 | $235,000 |
| 2026-10-27 | 1,256 | 126 | 377 | 233 | $549,898 | $235,000 |
| 2026-10-29 | 1,258 | 107 | 387 | 224 | $549,900 | $235,000 |
| 2026-10-30 | 1,263 | 107 | 386 | 225 | $549,900 | $235,000 |
| 2026-10-31 | 1,266 | 103 | 366 | 223 | $549,500 | $235,000 |
| 2026-11-01 | 1,248 | 100 | 366 | 204 | $549,000 | $235,000 |
| 2026-11-02 | 1,259 | 105 | 363 | 196 | $549,250 | $235,000 |
| 2026-11-03 | 1,264 | 108 | 354 | 213 | $549,250 | $235,000 |
| 2026-11-04 | 1,265 | 111 | 344 | 227 | $549,000 | $235,000 |
| 2026-11-05 | 1,271 | 110 | 350 | 213 | $542,500 | $235,000 |
| 2026-11-06 | 1,270 | 107 | 350 | 219 | $549,000 | $235,000 |
| 2026-11-07 | 1,282 | 122 | 345 | 224 | $549,000 | $235,250 |
Boynton Beach Rental Market at a Glance
Updated November 7, 2026 from BeachesMLS.
- 326homes for rent
- $2,650/momedian asking rent
- 40new rentals this week
- 112leased in the last 30 days
| Houses & townhomes | Condos & apartments | |
|---|---|---|
| Active rentals | 154 | 172 |
| Median asking rent | $3,400/mo | $2,185/mo |
| Median rent per sq ft | $2.09/sq ft | $2.18/sq ft |
| Average days on market | 58 days | 76 days |
| Leased in the last 90 days | 169 | 168 |
| Median leased rent (90 days) | $3,100/mo | $2,100/mo |
| Median leased rent vs. a year ago | +3.3% | +5% |
Source: BeachesMLS. Asking rents are active rentals as of November 7, 2026; leased rents cover leases signed in the last 90 days, compared with the same 90 days one year earlier. Not an appraisal.
Home Prices in Boynton Beach
Over the last 90 days the median single-family home in Boynton Beach sold for $535,000 ($285 per square foot) and the median condo or townhome for $226,500 ($186 per square foot). Against the same 90 days a year earlier that is +5.3% for single-family homes and -10.1% for condos. Homes on the market now are asking a median $549,000 (single-family) and $235,000 (condos and townhomes). Medians describe the middle of the market; a waterfront estate and a garden condo pull in opposite directions, which is why the two segments are reported separately.
Inventory and the Pace of Sales
1,281 homes and condos are for sale in Boynton Beach today, 118 of them listed in the last seven days, and 342 are under contract. 221 sales closed in the last 30 days. Single-family homes carry 3.5 months of inventory and condos 6.9 months, which makes the single-family side a seller's market: under four months favours sellers, over six favours buyers. Active single-family listings have been on the market 82 days on average, condos 121 days.
Single-Family Homes vs. Condos and Townhomes
The two halves of the Boynton Beach market move differently. Single-family sellers achieved 96.9% of their asking price on the typical sale in the last 90 days after 58 days on market; condo and townhome sellers achieved 95.9% after 85 days. 420 single-family homes and 264 condos and townhomes closed in that window. Condo pricing also carries the building's fees, reserves and rental rules, so a low list price in an older tower is not the same deal as a low list price on a lot.
The Last Twelve Months
3,227 residential sales closed in Boynton Beach over the last twelve months. The whole-market median sold price moved from $401,800 in Dec 2025 to $374,000 in Oct 2026, a change of -6.9%. The month-by-month table below shows closings, median price, price per square foot and days to sell; the current month is partial until it closes.
What These Figures Mean If You Are Selling in Boynton Beach
The figures above describe all of Boynton Beach. Your price comes from the closed sales that match your home: the same neighborhood, the same water or golf course position, the same age and condition. The sale to list ratio shows how far buyers are negotiating below asking, days on market shows how long a well priced home waits, and months of inventory shows whether buyers or sellers hold the leverage this season. Request the review below and a broker applies all three to your address before you decide on a price.
Investing in Boynton Beach
Investors buy in Boynton Beach for entry prices below Delray Beach and Boca Raton, for the rental demand from families in the western communities and from seasonal tenants near the marina, and for condos in the 55-plus communities where leasing is allowed. Association rental rules decide the strategy here, so we check them first. We track price reductions, new listings and days on market daily.
Follow the Boynton Beach Market as It Moves
Leave your email on this page and BreakThru Realty sends you each new Boynton Beach listing and price drop the day it reaches the MLS, with no account needed. Owners can request a review of what their own home is worth against these figures; buyers can ask for a showing or a search.
Thinking About Selling in Boynton Beach?
The median Boynton Beach single family home closed at $535,000 in the last 90 days and took 58 days to go under contract. Prices in your neighborhood may differ from the city average. Your buyer may already be looking. BreakThru Realty works with hundreds of prequalified buyers searching for properties. Enter your address and a licensed broker prepares your selling options from the closed sales nearest your home and checks it against the buyers on file.
- A value range built from comparable Boynton Beach sales, with the reasoning
- Whether a buyer already working with BreakThru Realty is looking for a property like yours
- The plan that reaches the rest of the market if no buyer on file fits
- An estimate of your selling costs and what you would keep after closing
- Your timing, privacy and goals, worked through before anything is listed
Selling in Boynton Beach?
See what your home is worth from recent Boynton Beach sales, the days on market and today's buyer demand. See what my home would sell for.
Buying in Boynton Beach?
Every home, condo and townhome for sale in Boynton Beach, straight from the MLS and updated through the day. Find my Boynton Beach home.
Investing in Boynton Beach?
Multifamily, rental and value add property in Boynton Beach, with the taxes, association fees and price history on every listing. Evaluate Boynton Beach investments.
Boynton Beach Housing Market FAQ
- What is the median home price in Boynton Beach?
- Over the last 90 days the median sold price in Boynton Beach was $535,000 for single-family homes and $226,500 for condos and townhomes, from BeachesMLS closings as of November 8, 2026. Homes for sale now are asking a median $549,000 and $235,000 respectively. These figures refresh daily on this page.
- Is Boynton Beach a buyer's market or a seller's market?
- By months of inventory, the single-family side of Boynton Beach is a seller's market right now: 3.5 months of supply, with condos and townhomes at 6.9 months (buyer's market). Under four months of supply favours sellers, over six favours buyers, and the two segments often sit on different sides of that line in South Florida.
- How long does it take to sell a home in Boynton Beach?
- Single-family homes that closed in Boynton Beach in the last 90 days had been on the market 58 days on average, and condos and townhomes 85 days. Sellers achieved 96.9% of their asking price on the typical single-family sale and 95.9% on the typical condo sale. Well-priced homes go under contract in the first few weeks; the average is pulled up by listings that started too high.
- Are home prices in Boynton Beach going up or down?
- Over the last twelve months the whole-market median sold price in Boynton Beach moved from $401,800 (Dec 2025) to $374,000 (Oct 2026), -6.9%. Comparing the last 90 days with the same 90 days a year earlier, single-family medians are +5.3% and condo medians -10.1%. Monthly medians swing with the mix of homes that happened to close, so the direction over several months matters more than any one month.
- Are condo prices in Boynton Beach going up or down?
- The median condo or townhome in Boynton Beach closed at $226,500 in the last 90 days, down 10.1% against the same 90 days a year earlier, with 6.9 months of condo inventory on the market and 85 days on average to go under contract, from BeachesMLS closings as of November 8, 2026. A citywide condo median blends every building and line; what a particular condo is worth comes from the closings in its own building, its association fees and its reserve and inspection status.
- What is the median rent in Boynton Beach?
- The median asking rent in Boynton Beach is $2,650 a month across 326 active rentals: $3,400 for houses and townhomes and $2,185 for condos and apartments. The Boynton Beach rentals hub carries the full rental market table, updated daily.
- Where do these numbers come from?
- Every figure is computed from BeachesMLS: active listings are counted as of the refresh date (November 8, 2026), sold figures cover closings in the last 90 days compared with the same 90 days a year earlier, and the monthly table buckets closed sales by closing date. Statistics refresh once a day and are cached; inventory over time comes from our own daily snapshots. Nothing on this page is typed by hand, and none of it is an appraisal. BreakThru Realty's market data methodology page explains every calculation, and broker of record Tyson E. Sam reviews the method and the written guidance in this report.
Explore
- Boynton Beach real estate & homes for sale
- Sell your Boynton Beach home
- Recently sold homes in Boynton Beach
- What is my Boynton Beach home worth?
- Guaranteed cash offer
- Boynton Beach rentals & rent prices
- Palm Beach County housing market
- BreakThru Realty Research: every South Florida market report
- How these market figures are calculated